
Custom Dashboard
Qualified makes it easy to create custom dashboards that you can use to understand your website visitors, rep performance, information about interactions, conversations and more.
<span id="introduction"></span>
Introduction to Custom Dashboards
Qualified Dashboards break down your website traffic and display how those visitors interacted with Qualified during their sessions. Within Qualified Dashboards, review your sales team's availability, which reps interact with the most visitors, and which reps create the most leads.
Dashboard Definitions
Below we'll define terms specific to Qualified that you'll see in the various dashboard tiles. These sections reveal important information about your website visitors and their interactions with Qualified.
- Sessions: A session is defined as every time a visitor is on the website. A session will end for a visitor when they are idle for more than 60 minutes or a visitor left your site for at least five minutes before returning. A visitor can have multiple sessions on your website.
- Experiences: An experience is the Qualified message and flow that you've created to show up on a particular page, for a particular visitor set, or triggered by a button or form on your website.
- Waiting for Reps: This is defined by Qualified as any visitor who has hit your Route for Inbound Chat step within your experience and waited for a rep to pick up the conversation. This includes all visitors who were shown the meeting booker (no reps available), visitors who waited and did not receive a chat (reps available but did not start a conversation), and those visitors who did have a conversation with your sales team.
- Conversations: A conversation is defined as a back and forth interaction between a visitor and either a human rep on your team or the Qualified chatbot.
Using Your Dashboard
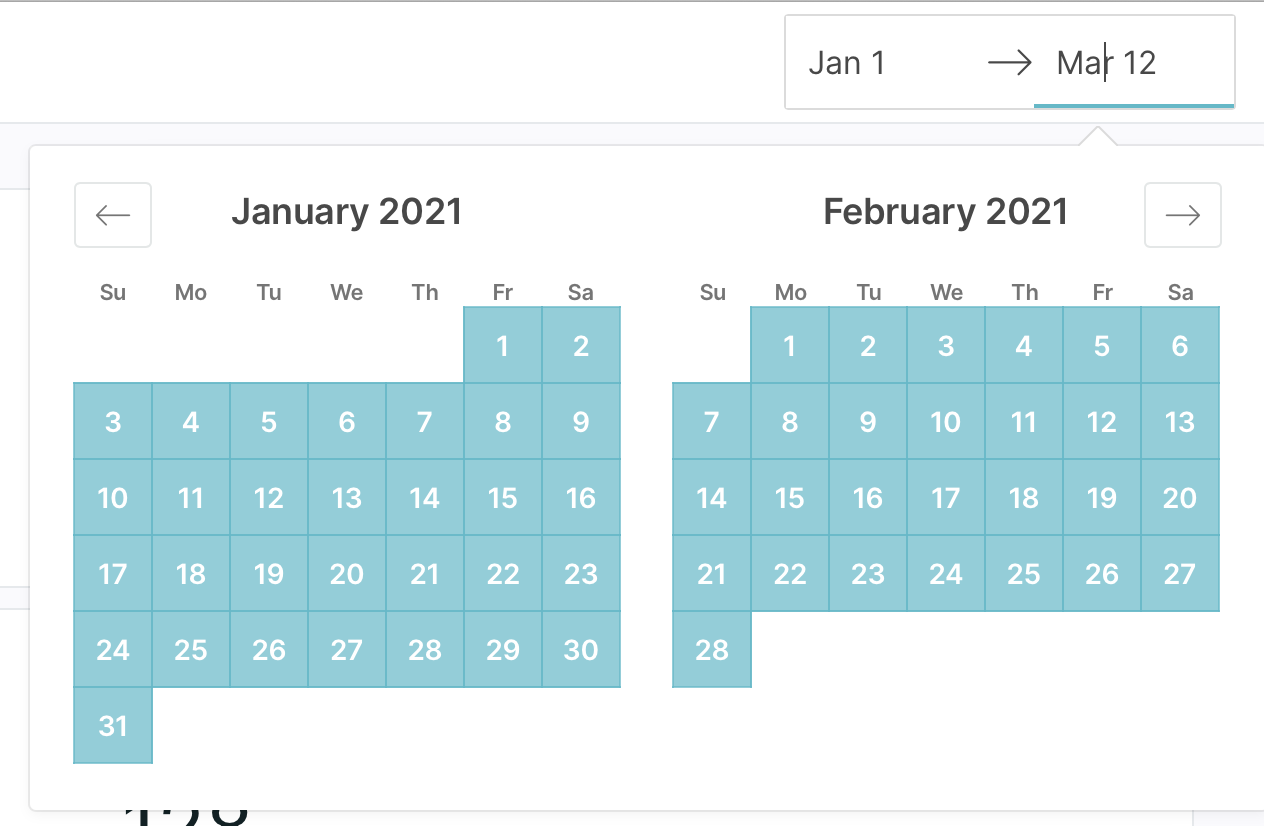
Use the date picker on the top right corner of your dashboard to select the dates you’d like to filter your data by. You'll notice that data is only available for the previous 18 months. Any data prior to 18 months will not be displayed in app. Please reach out to your Qualified Success Architect for any questions or data requests.
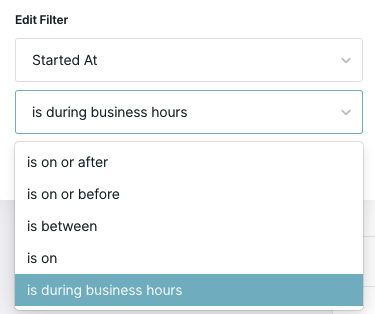
Business Hours in Session Reports
Qualified allows you to report on sessions created solely during business hours. This feature may require you to contact your Qualified Success Architect to enable.
Once enabled, you will see the "Business Hours" setting page under your Team Calendar. After adding your team's business hours and default time zone, reports that use the "Started at" or "Ended at" filters will include an "is during business hours" operator.
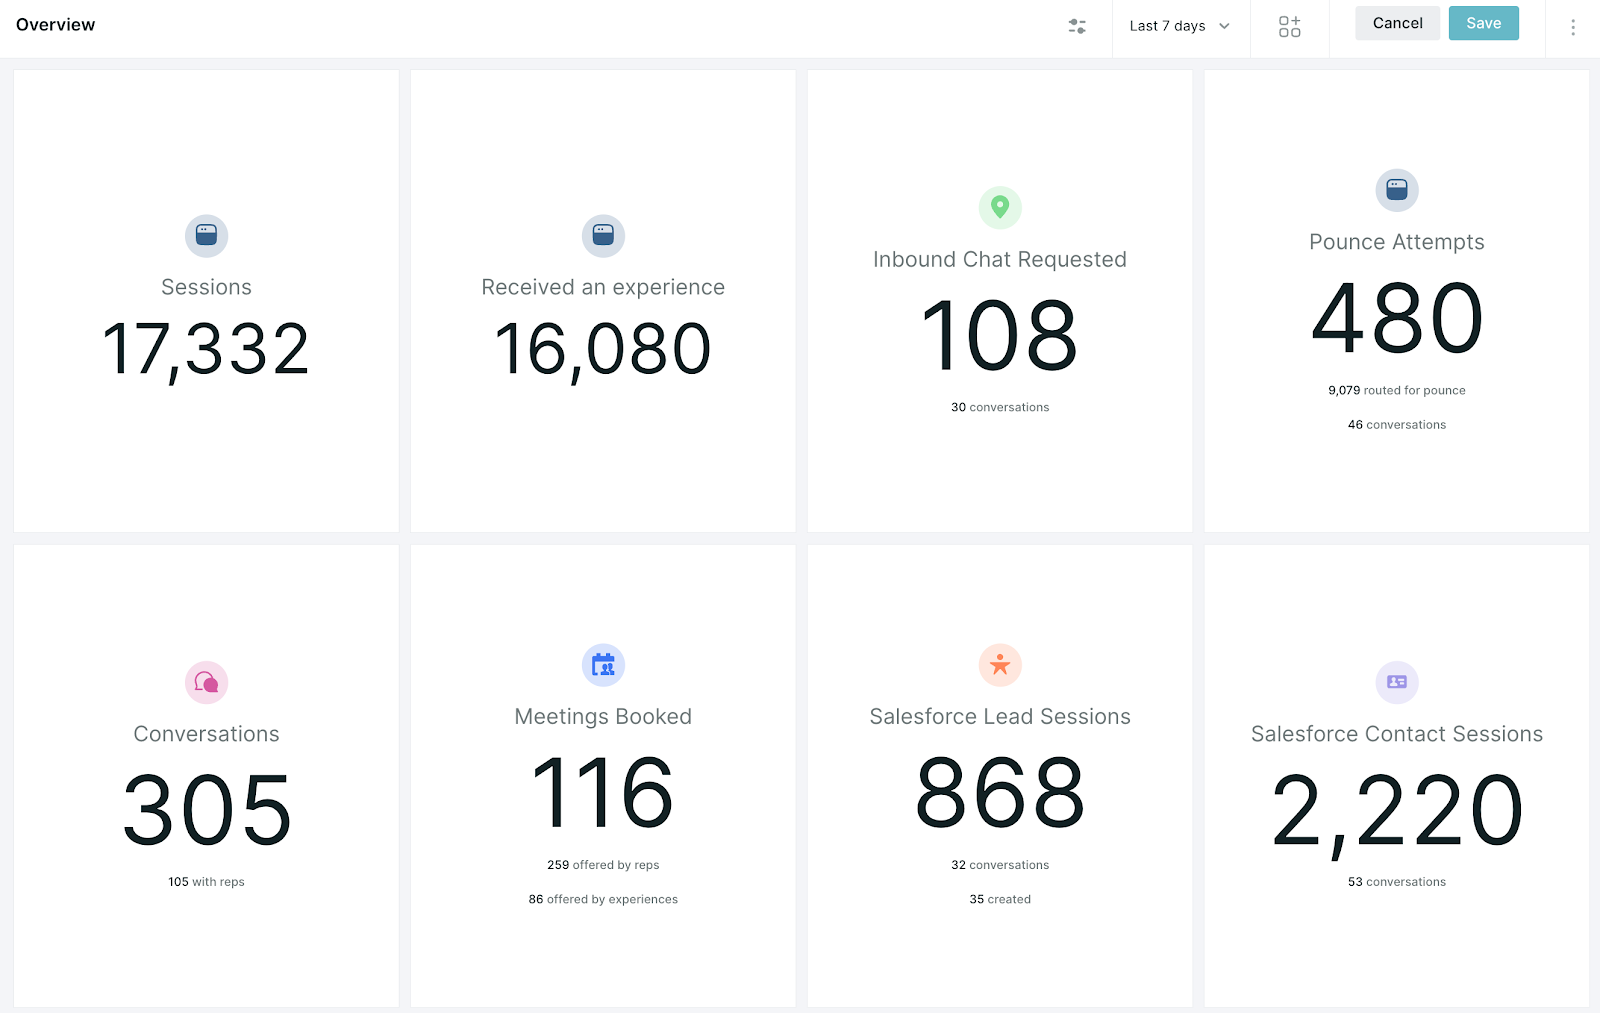
Dashboard Tiles
To see more detail behind each number in your dashboard, click the number in the tile to open a related report in the Reports section of Qualified. Each report will show the visitor sessions that correspond with the tile during the date range you've selected.
Salesforce Lead Sessions
The large number on this tile represents the number of sessions on your site that a lead had. For example, one lead could have multiple sessions within your time range (that's a good thing!) and we count all of them.
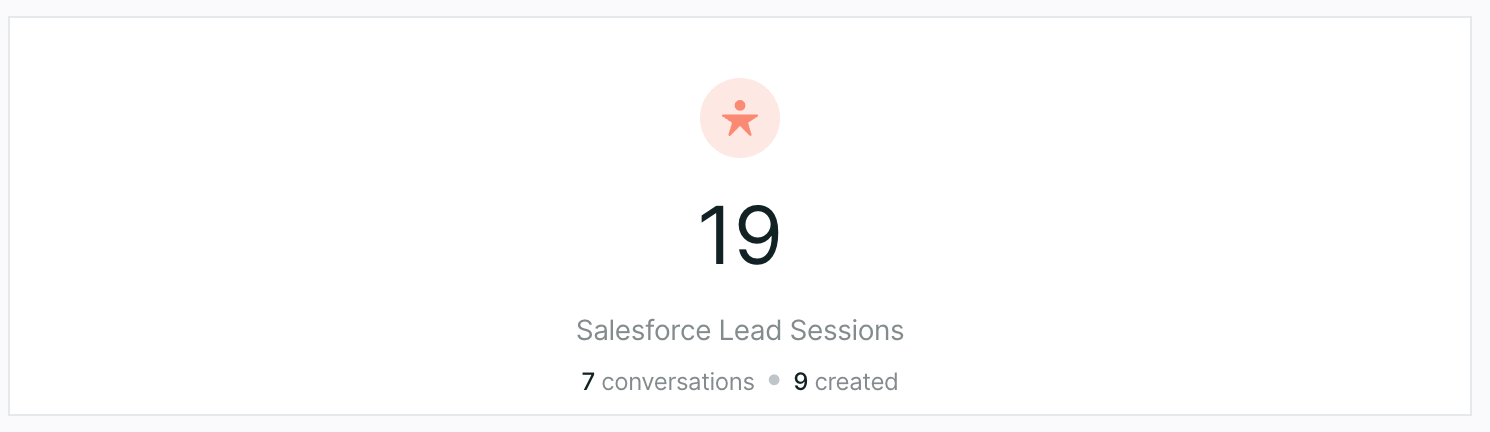
The two smaller numbers you see will show you:
- The number of conversations that occurred between the Qualified chatbot or your sales reps and the Lead visitor
- How many new leads were created by Qualified
Salesforce Contact & Account Sessions
These numbers show the number of sessions, including conversations, from visitors associated with a Salesforce contact or account record. (At this time, Qualified does not create contacts or accounts.)
Meetings Booked
In this tile you'll be able to see all sessions where meetings were booked with a visitor. It shows meetings offered by reps and meetings booked via a chatbot experience. Click on the numbers to drill down and see which reps offered the meetings as well as which experiences are capturing the most meetings.
Dashboard Charts
The dashboard tiles give an overview of each metric tracked by Qualified. The first tile you see at the top provides an overview and overall number of each metric, while the tiles below show the differences over time.
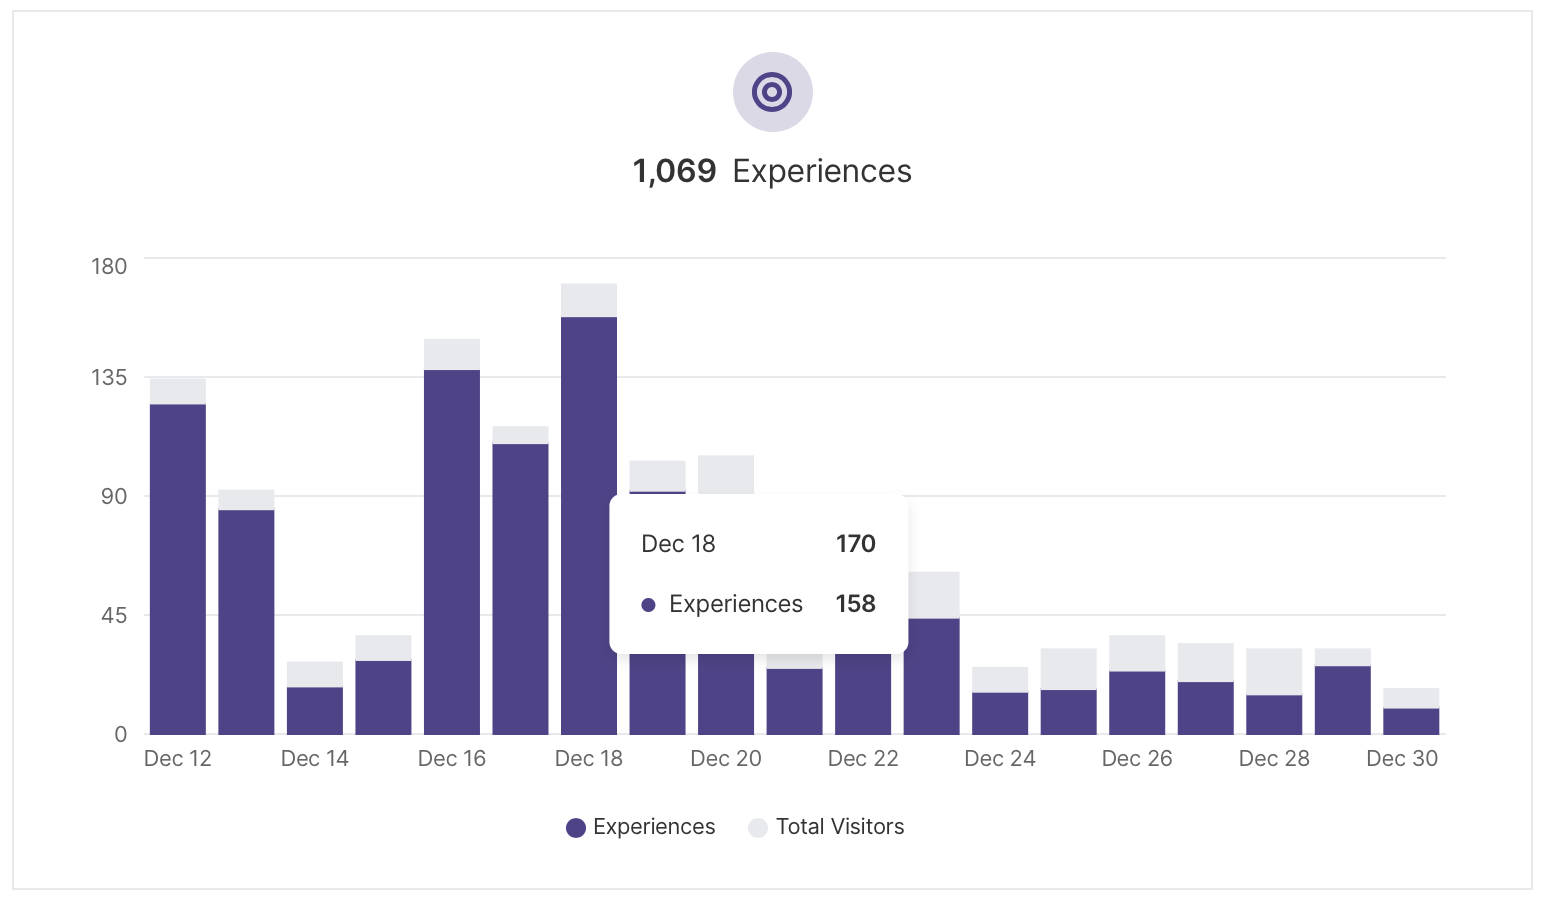
Experiences
Each time an experience is triggered on your site, we’ll count it here. This does not necessarily mean that a visitor has clicked on your experience, rather that it was triggered for a visitor.
Scroll down to the very bottom of your dashboard to see a break down of which experience has been the most engaging to your visitors.
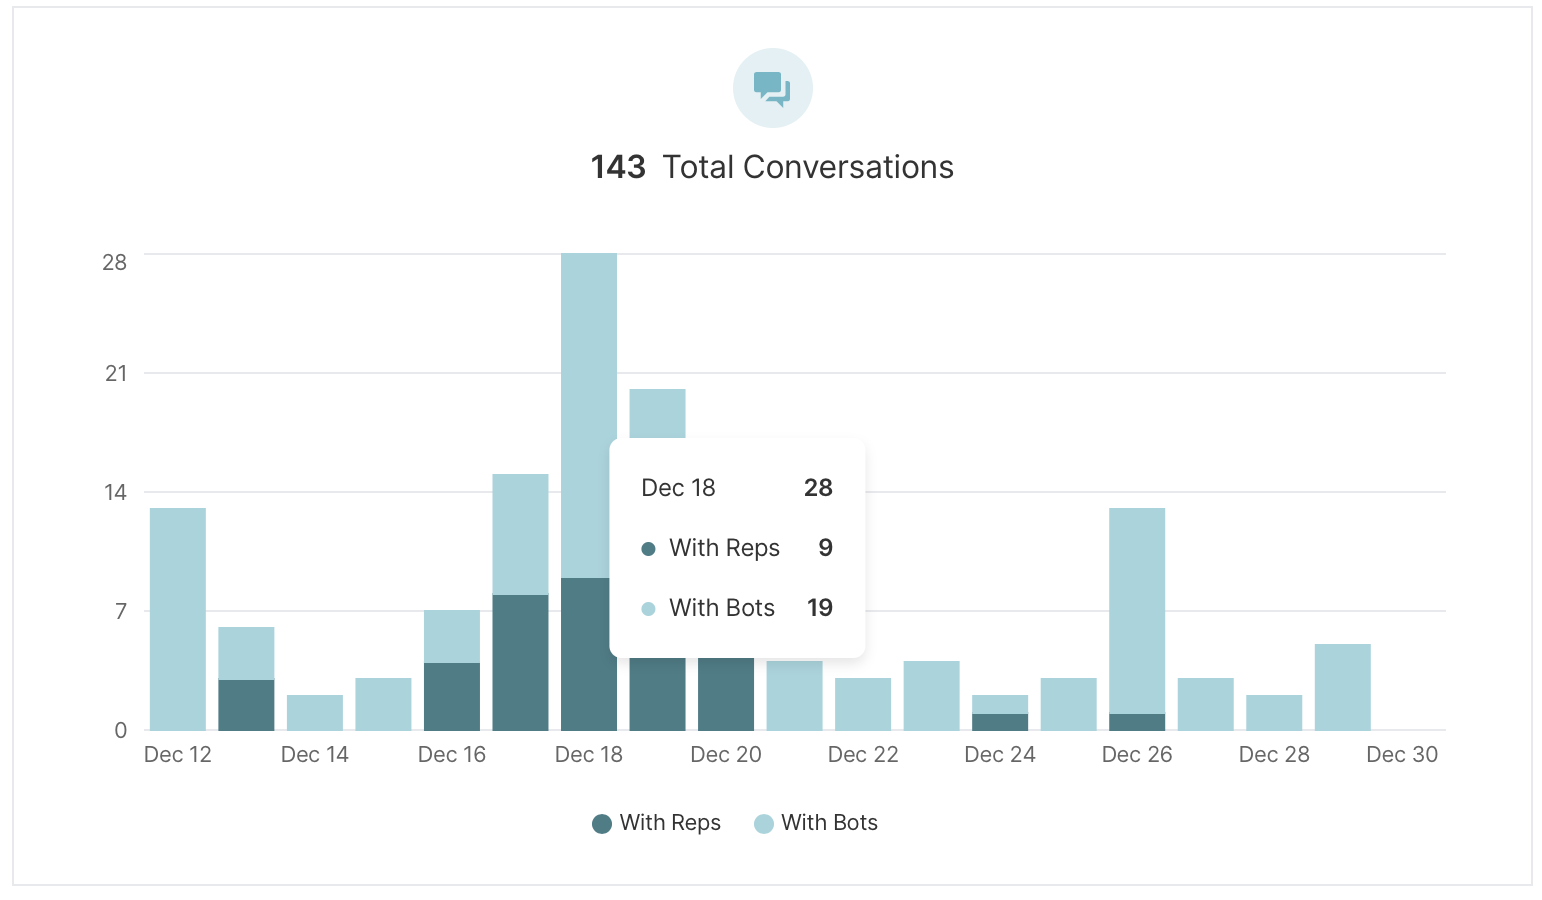
Conversations
You can see how many conversations your team has had by hovering over each day to see more details as well as a break down of your conversations by bots or reps.
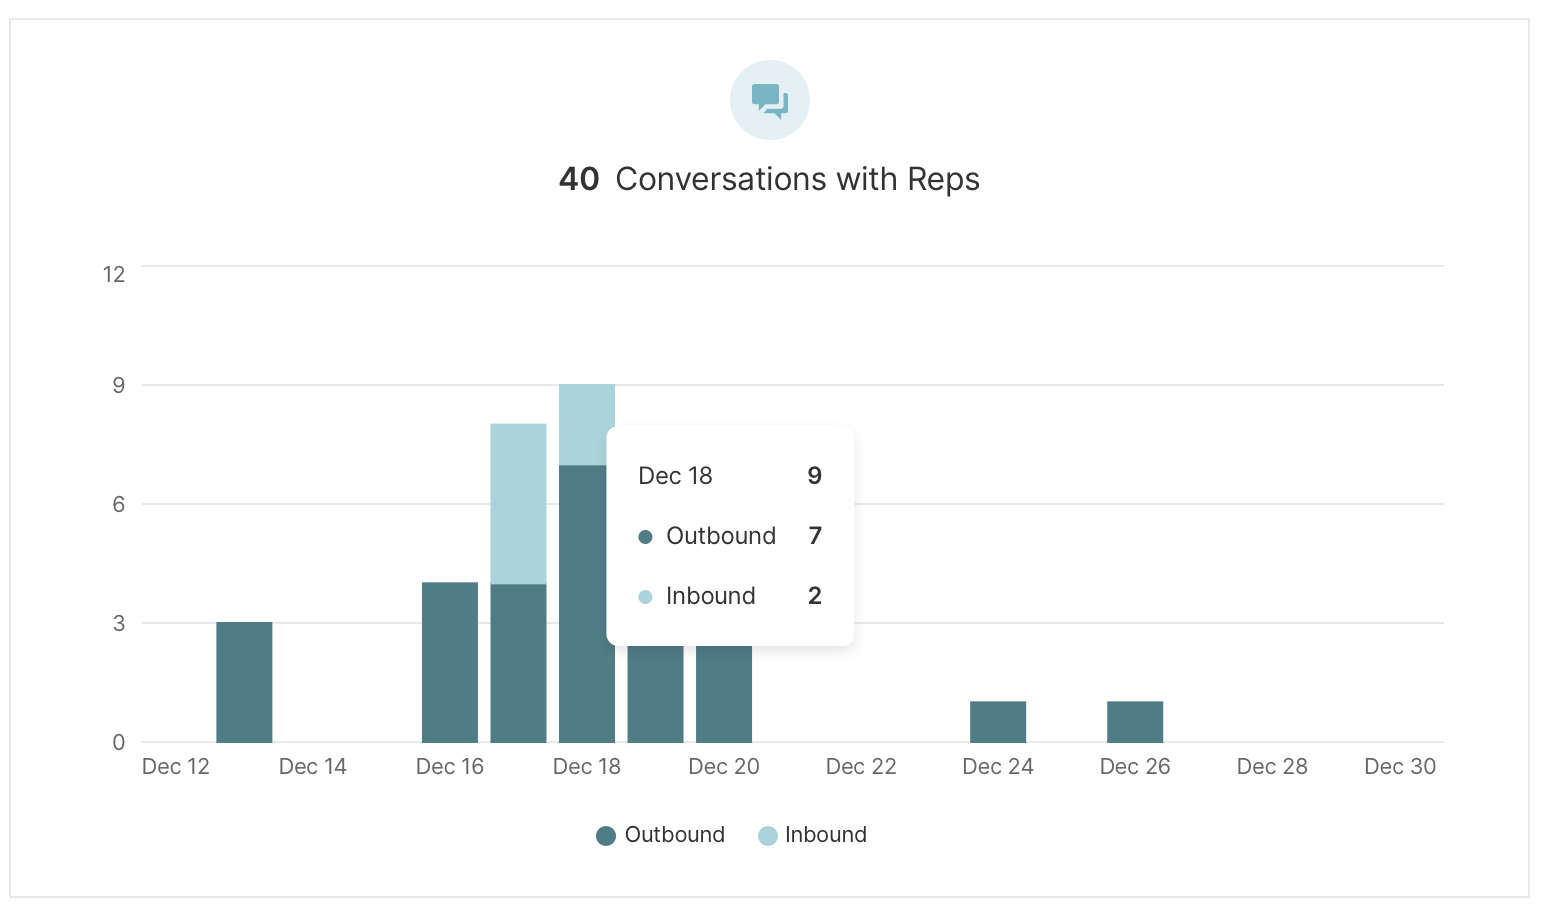
Conversations with Reps
Next to your overall conversations breakdown, you’ll see a bar chart that breaks down visitor conversations with your reps: outbound vs. inbound. Outbound conversations are those that have been started by your reps while inbound conversations are those first started by your visitors.
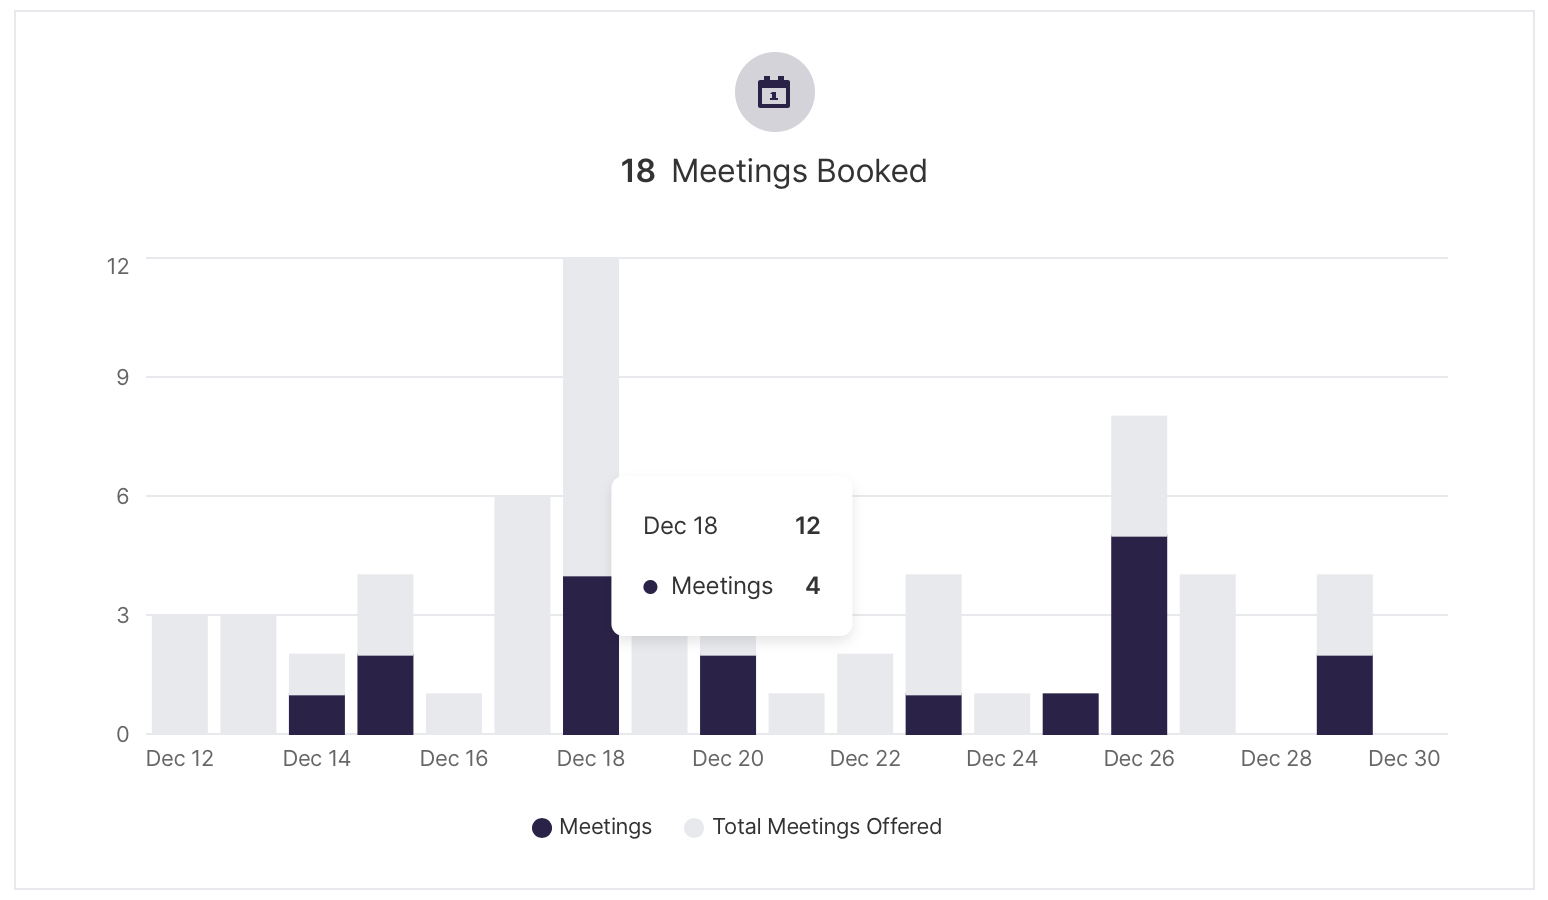
Meetings Booked
Meetings booked will show you how many visitors have engaged with your experiences and booked a meeting with one of your reps.
This could mean that the meeting booker was triggered by a chatbot or manually given to the visitor by a sales rep. Hover over the bar chart to see more details on each day shown.
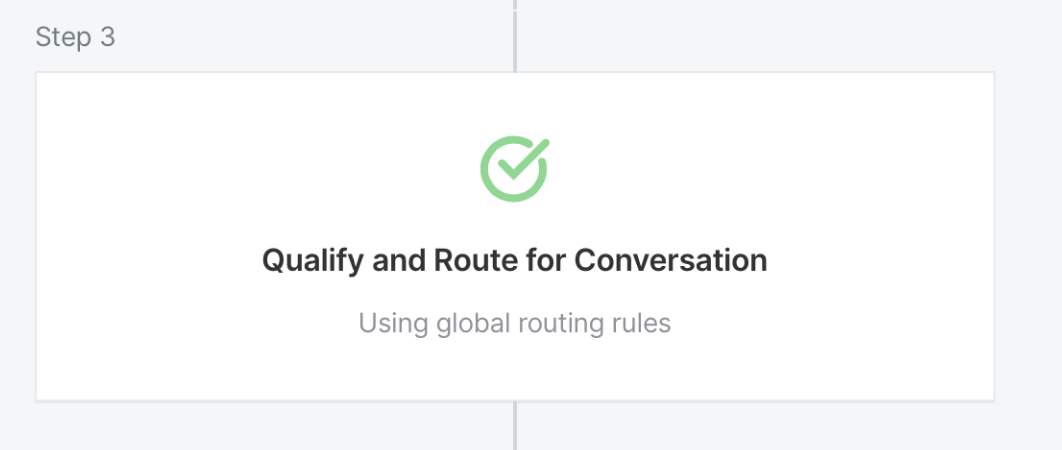
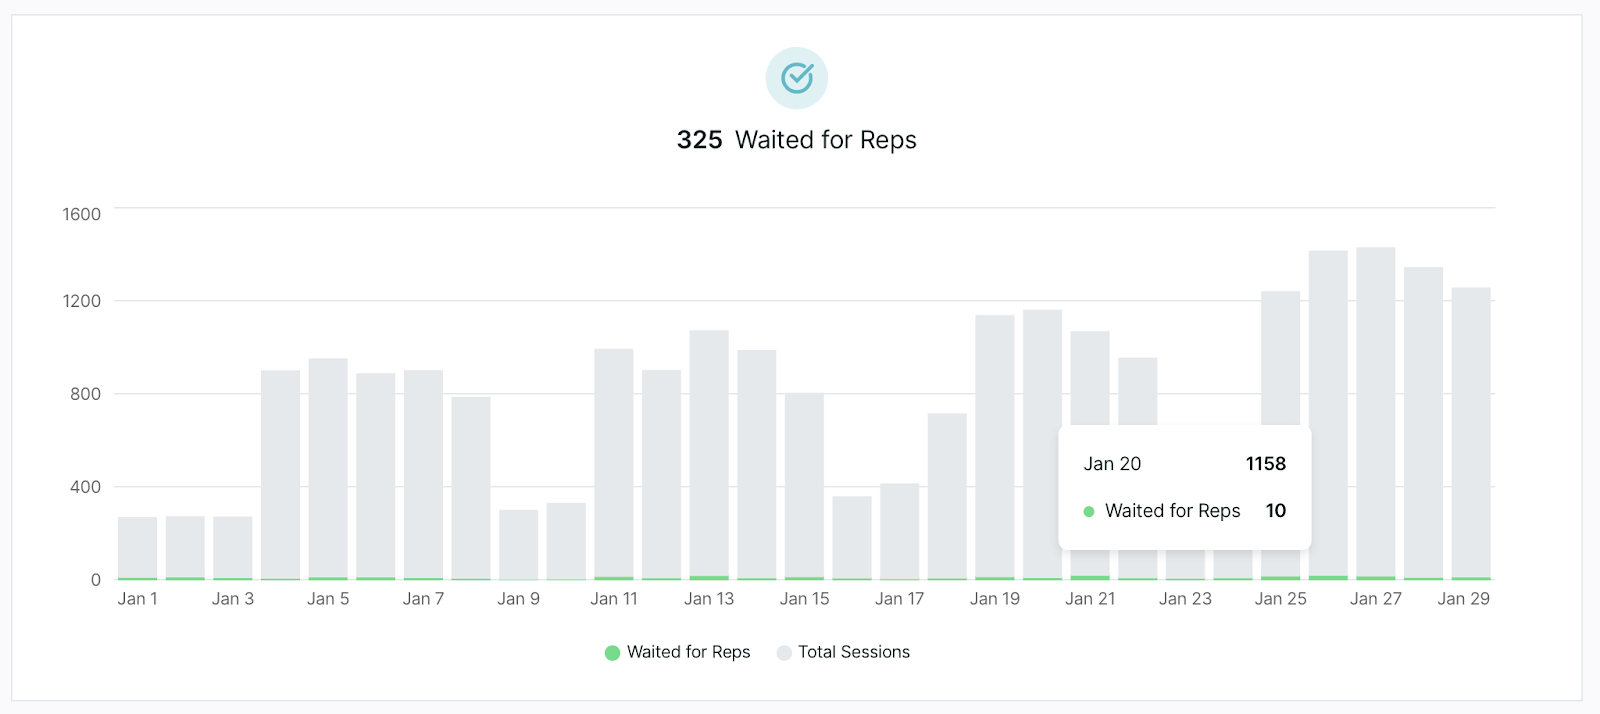
Waited for Reps
Waited for Reps tiles show which visitors reached your Qualified routing rules that have been set in your experience and have waited to speak with someone on your team.
You’ll notice these rules when you open up your experience and see the Qualify and Route step pictured below. Hover over the bars in the chart to see how many sessions took place during that day versus how many visitors waited to speak with your sales team.
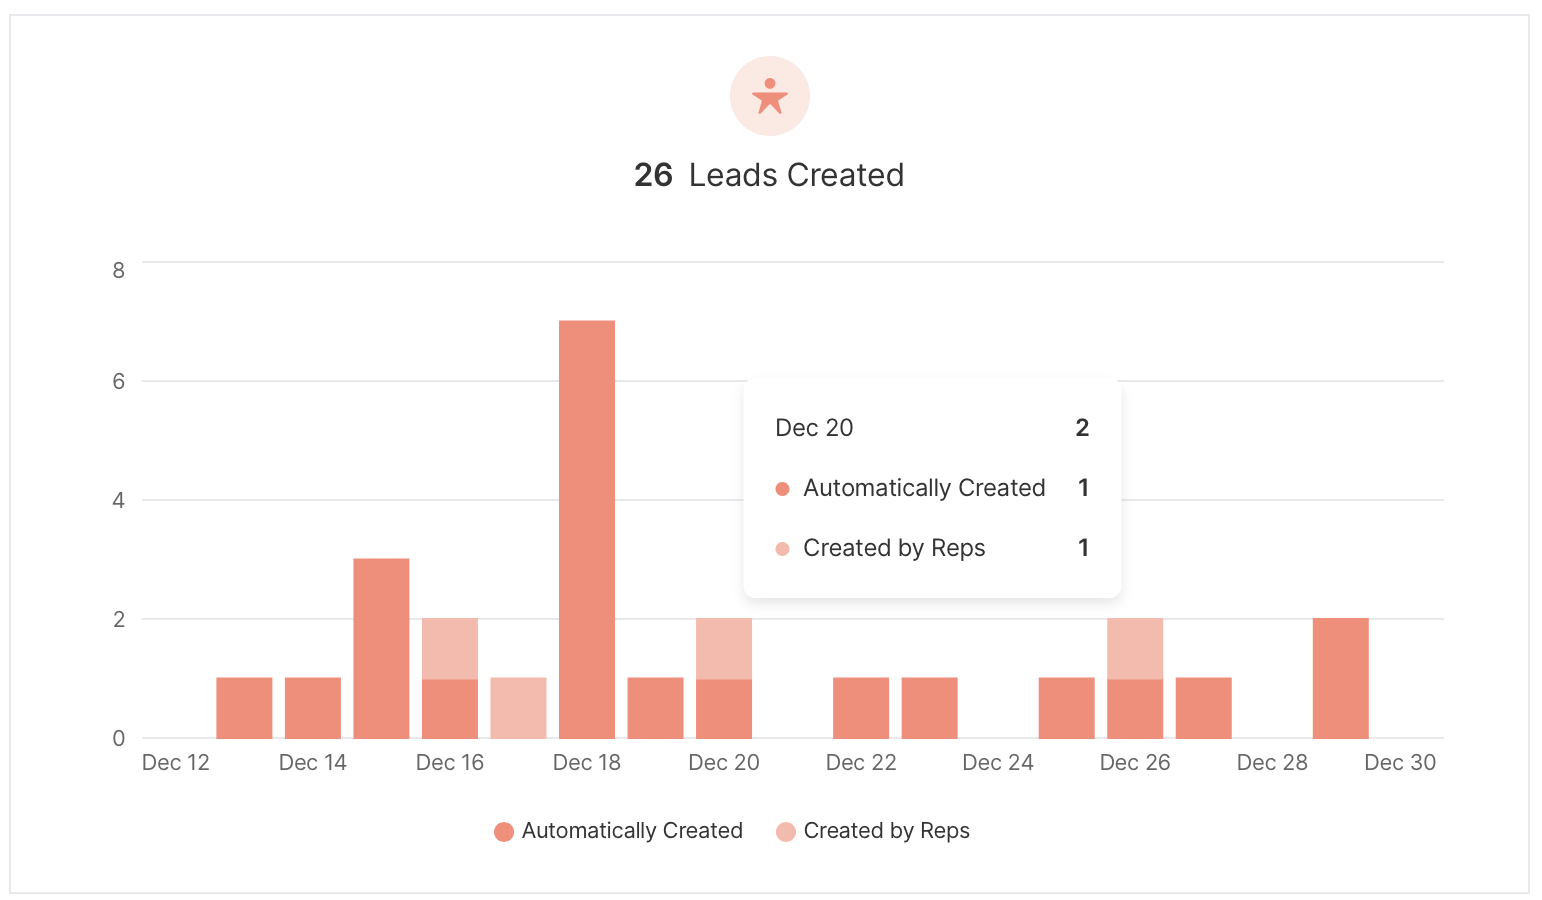
Leads Created
Next in your dashboard you’ll see how many leads have been created from your experiences. You’ll only see this piece of your dashboard when you use Salesforce to sync your visitors as Leads.
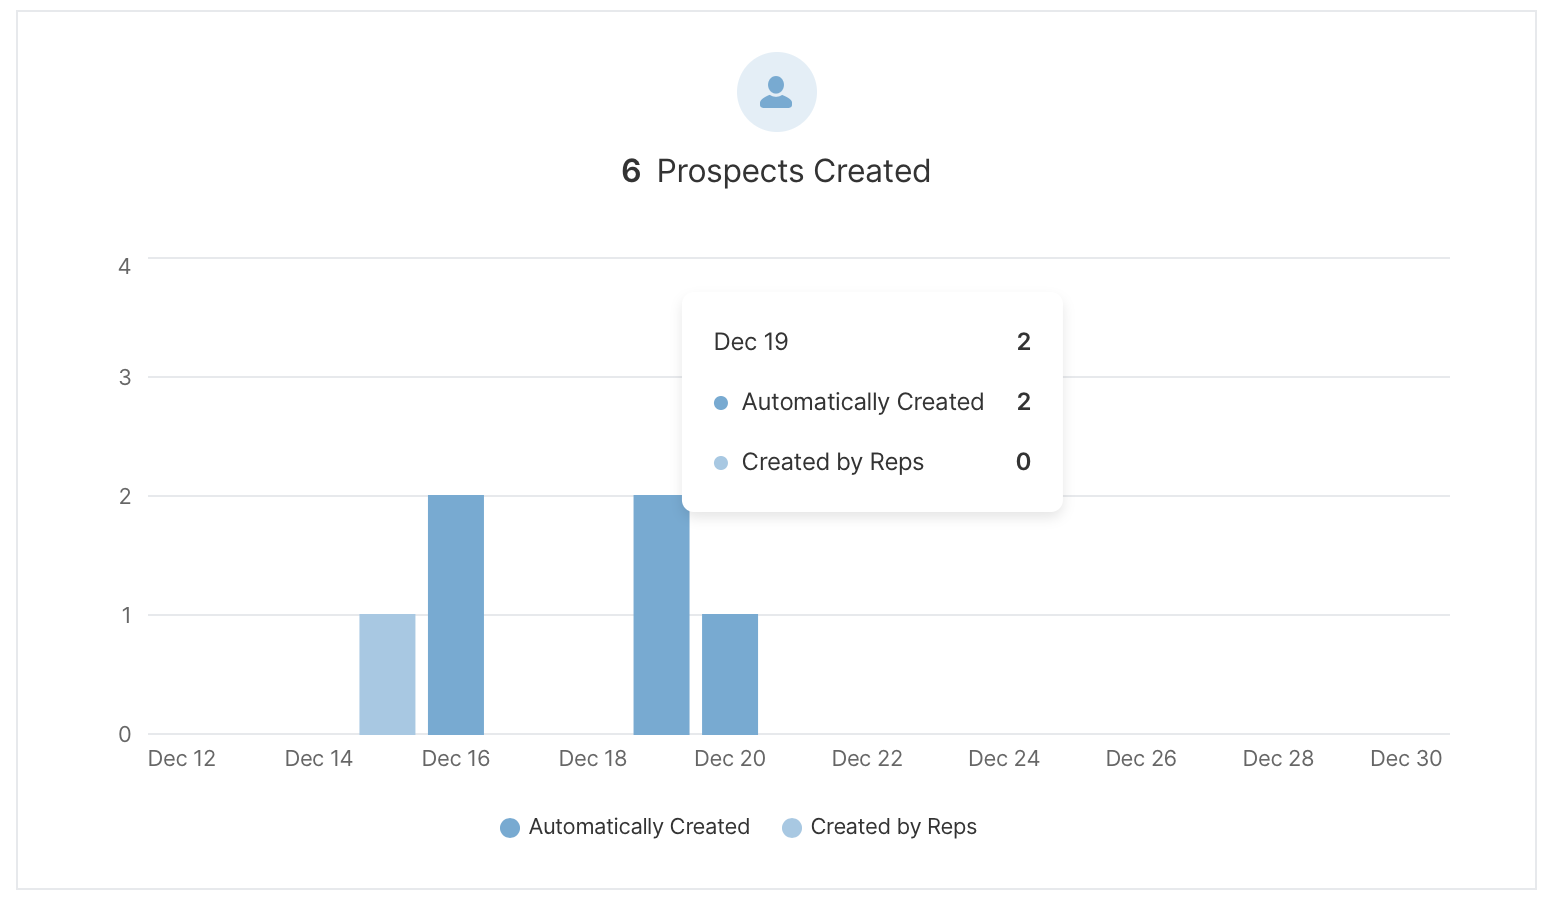
Prospects Created
If you use Pardot to sync your Prospects, you'll see a section in your dashboard for Prospects created from Qualified. We'll give you a break down of how many of these Prospects were created automatically using the rules in your experiences or created by your reps manually.
<span id="rep-performance"></span>
Rep Performance Components
The Qualified Rep Performance dashboard gives you a detailed overview of your sales team's success and availability using Qualified and allows for you and your team to break down metrics that mean the most to your success.
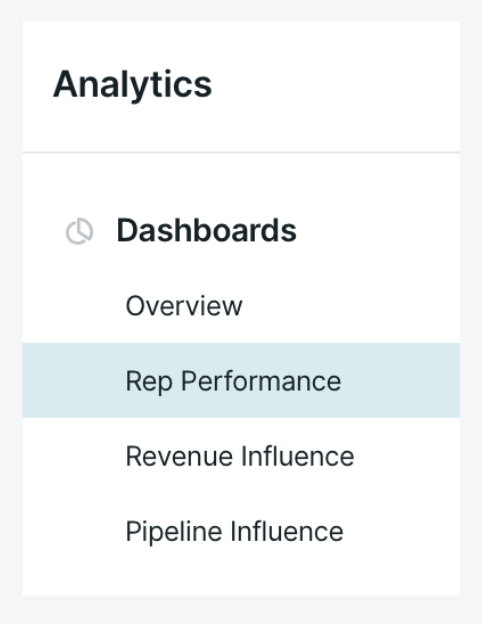
To get started, navigate as an administrator to Analytics → Rep Performance within your Qualified instance.
Dashboard Definitions
Below we'll define terms specific to Qualified that you'll see in the various dashboard tiles. These sections reveal important information about your website visitors and their interactions with Qualified.
- Sessions: A session is defined as every instance a visitor is on the website. A session will end for a visitor when they are idle for more than 60 minutes or a visitor has left your site for five minutes before returning. A visitor can have multiple sessions on your website.
- Waiting for Reps: This is defined by Qualified as any visitor who has hit your Route for Inbound chat step within your experience and waited for a rep to pick up the conversation. This includes all visitors who were shown the meeting booker (no reps available), visitors who waited and did not receive a chat (reps available but did not start a conversation), and those visitors who did have a conversation with your sales team.
- Conversations: A conversation is defined as a back and forth interaction between a visitor and either a sales rep on your team or the Qualified chatbot.
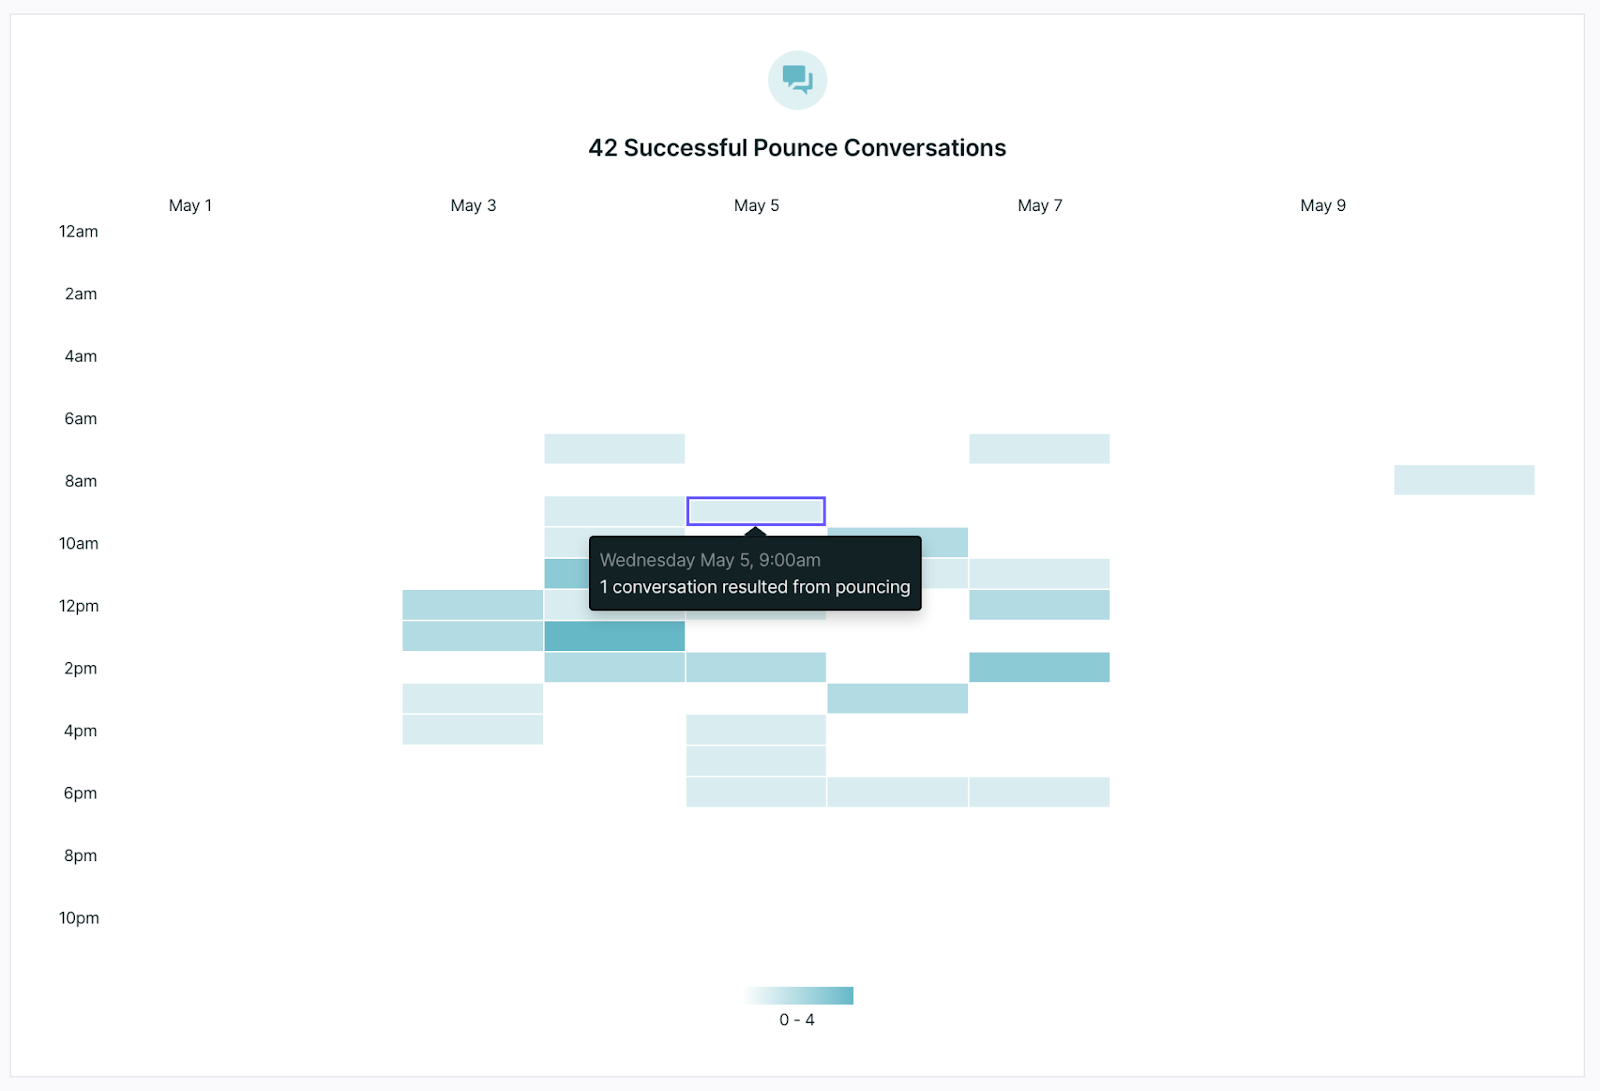
- Pounce: Pouncing is a Qualified term meaning to proactively engage with a visitor before they asked to chat with a rep. Usually determined via onsite routing rules, your reps will see the most high-value visitors in their Live Stream and have the opportunity to proactively engage.
Dashboard Charts
Sessions Routed to Reps for Pouncing
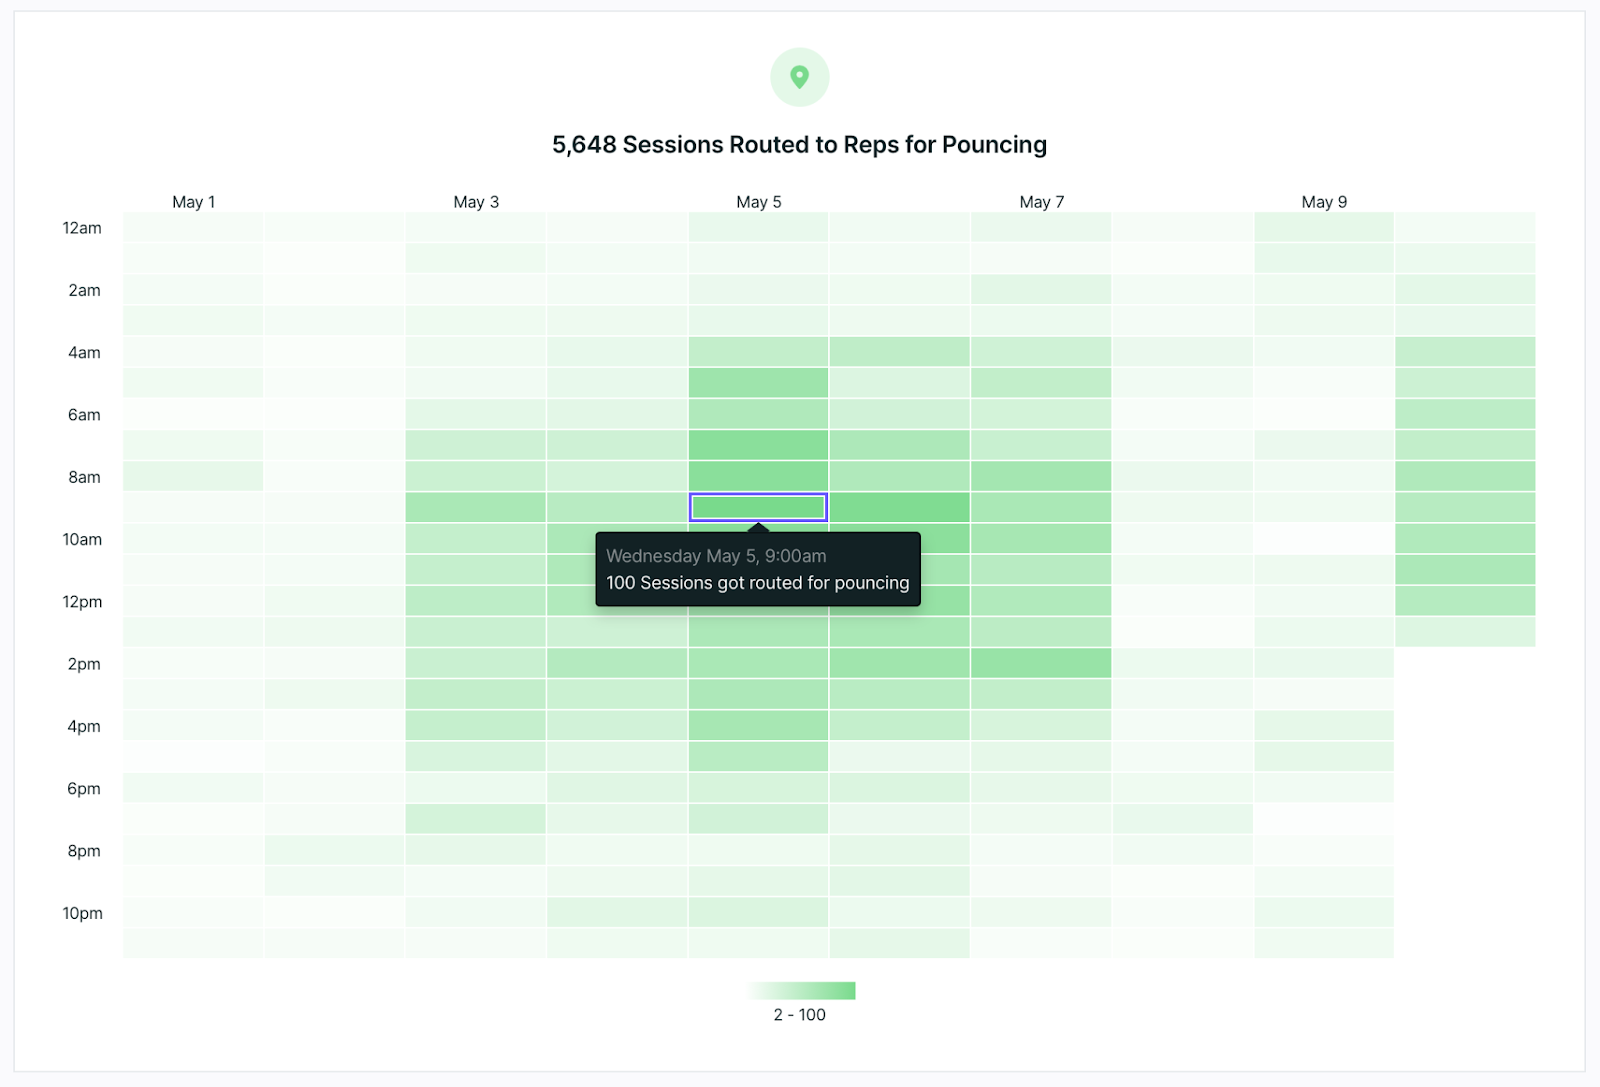
Use this dashboard tile to track how many visitors were routed to your sales rep. Click on a tile within the dashboard to see more details, including the exact visitor count within the hour.
See a drill-down of the visitor details by clicking on the date on the top of each column. This will take you to all visitors routed for conversations during this day including which experiences they received.
The times in the dashboard will reflect the time zone set in your Qualified profile.
Successful Pounce Conversations
The next dashboard tile shows how many of your sales reps attempted to pounce on your visitors and had a successful conversation with them. Notice the data tile you’ve selected follows you to the next tile making it easy to see the successful attempts during the same time frame.
Sessions Waited for Reps to Join
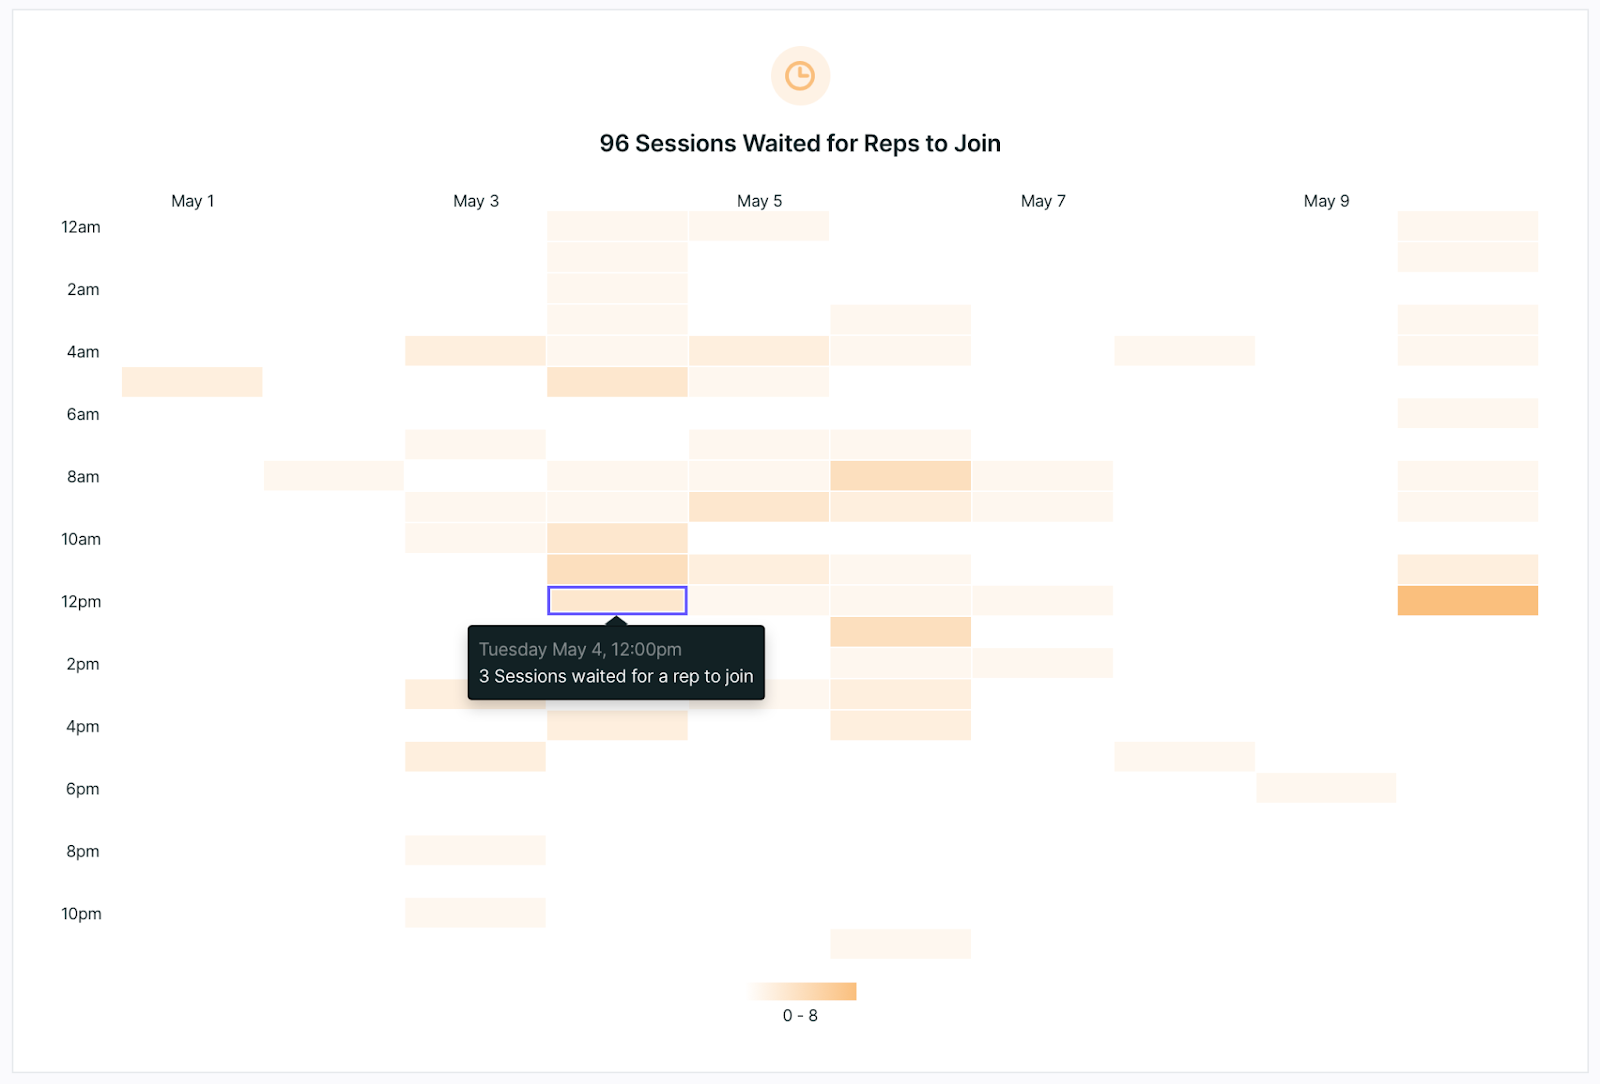
When a visitor hits your “Route for Inbound Chat” step within an experience they’ll be routed to your sales team according to the routing rules set within your account.
This dashboard tile will show how many visitors hit that step and then waited for a representative to join the conversation, regardless if they were shown the meeting booker or engaged in live conversation.
Reps Available
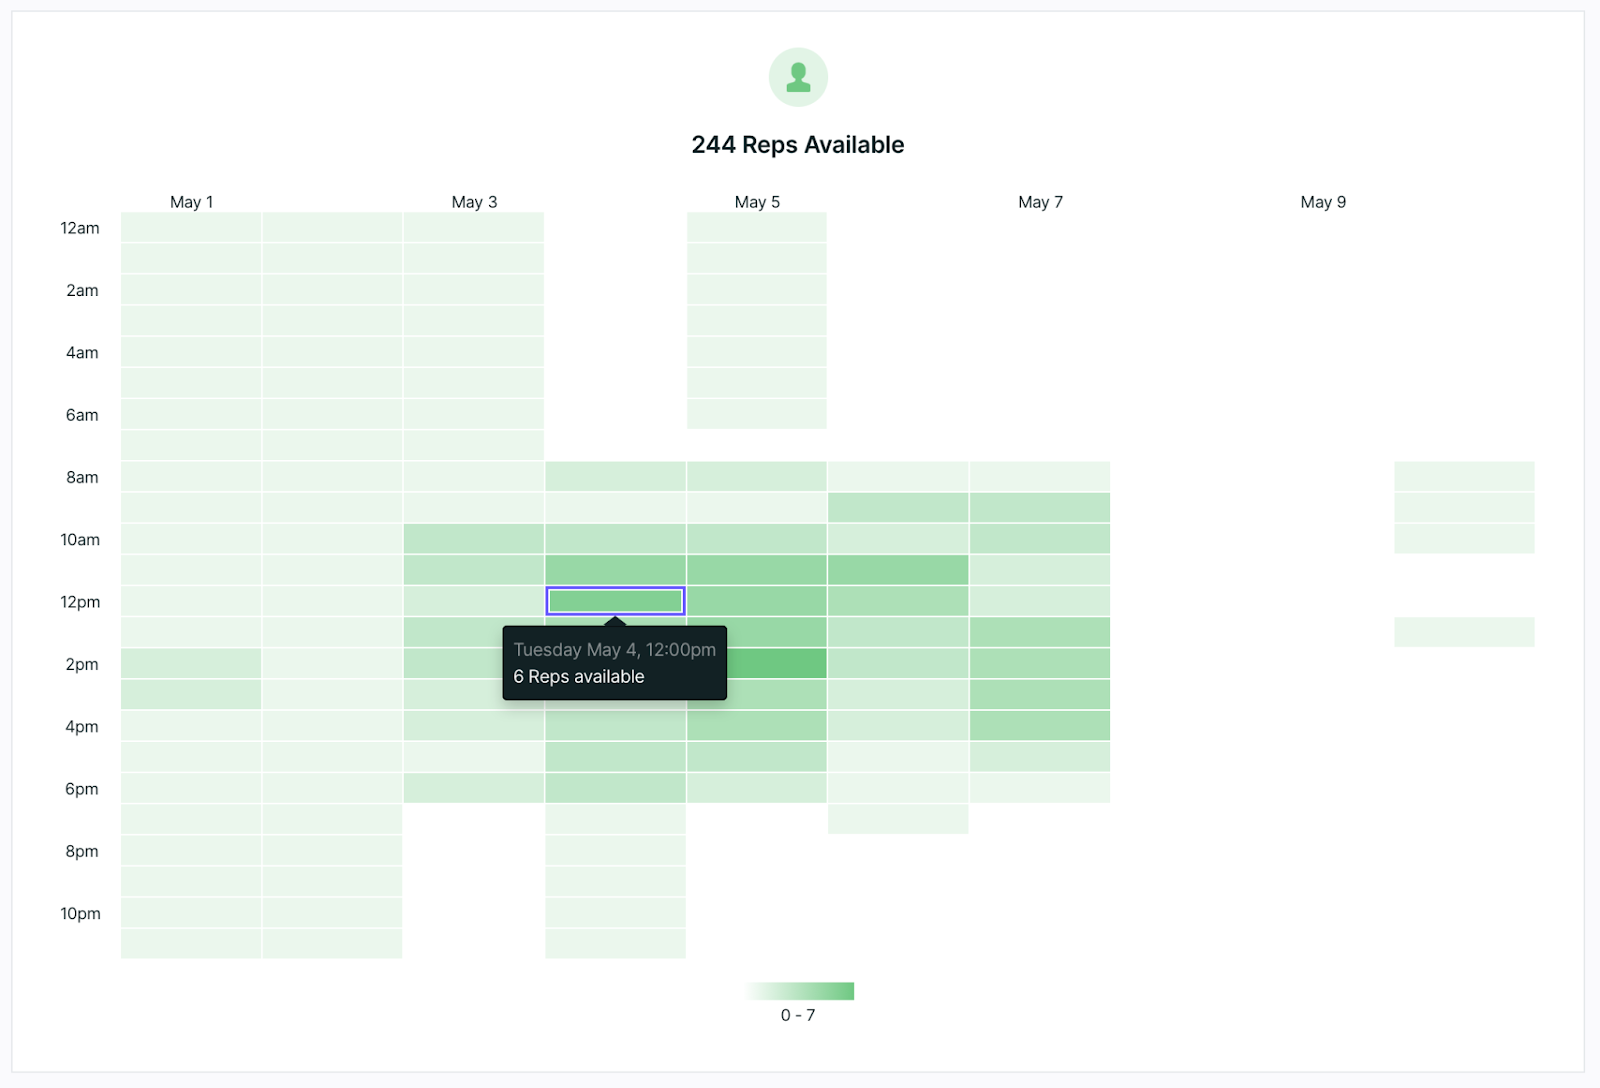
The Reps Available dashboard shows all reps that were available at each hour throughout a day.
At this time, it’s not possible to drill down into each tile to see which reps were available during the time selected.
Session Waited and Had a Conversation
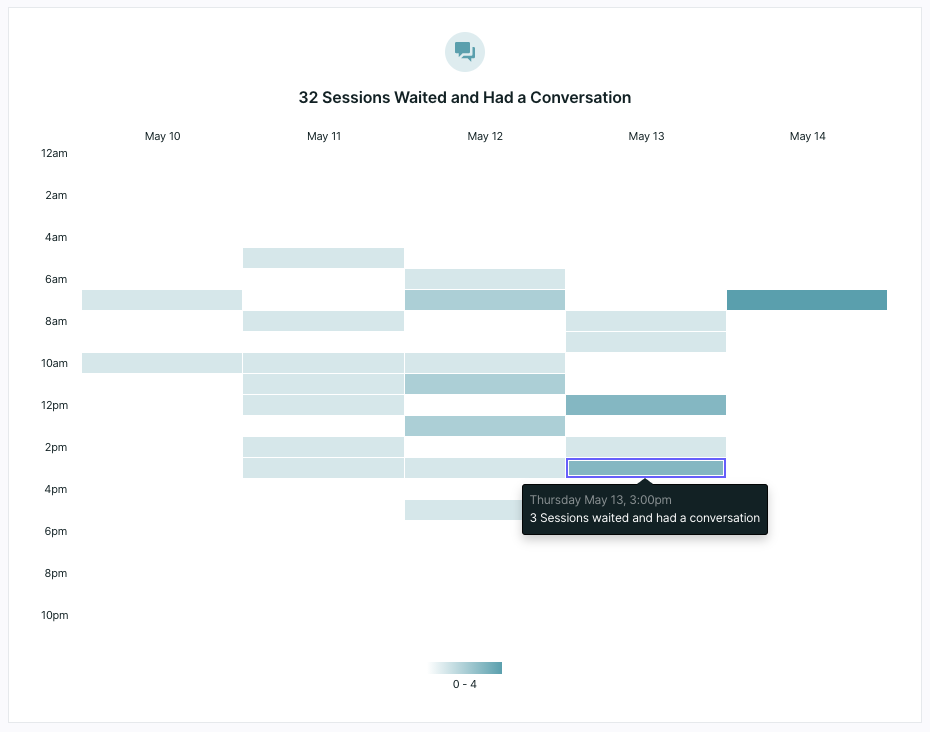
This dashboard tile shows you how many visitor sessions hit your "Route for Inbound Chat" node within your experience or were otherwise routed to your sales team and successfully had a conversation with someone on your team.
Sessions Waited and Had no Conversation
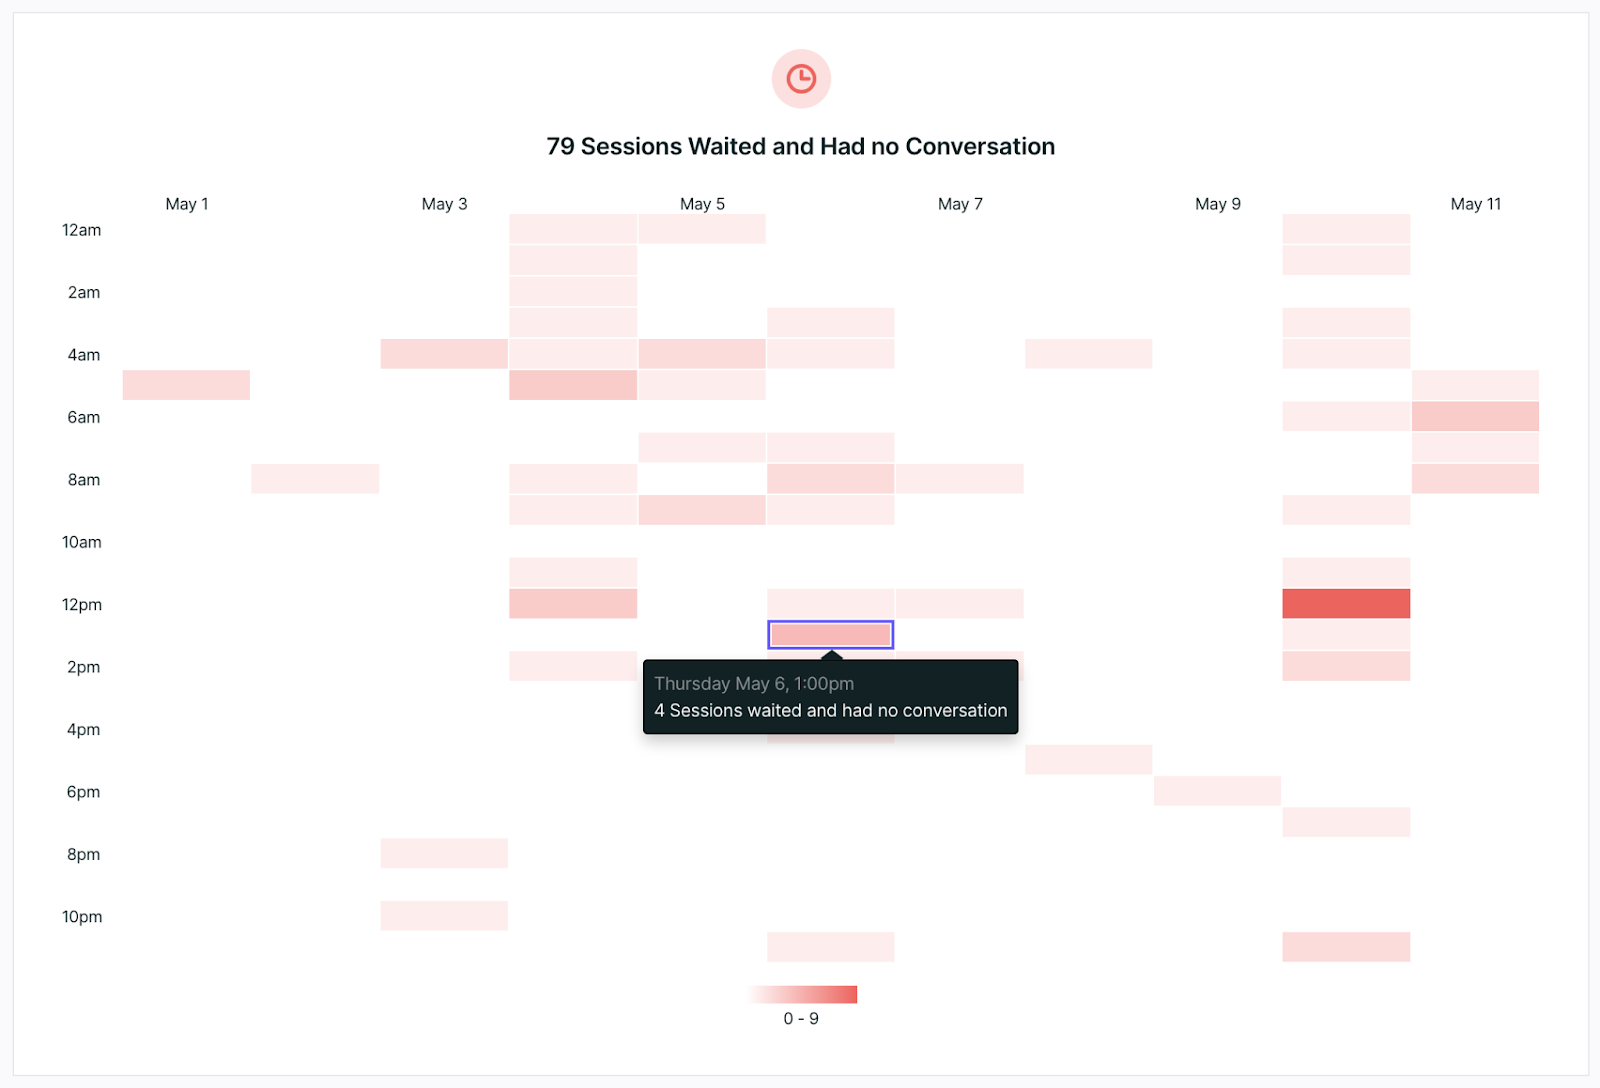
This last dashboard tile will show the number of sessions during your selected date range where a visitor was routed for chat but a rep never picked up. At this time either a meeting could have been booked, or the visitor could have left the site without a chat or meeting being booked.
Click on the date on the top of each column to drill down into a report of the tile to see more information about these visitors, including to see if they booked a meeting.
This tile reports a good metric for measuring the preparedness of your sales team. If there are many visitors in these tiles, it may be a good indication that your team should ensure their sound alerts are on to jump on a conversation as soon as a visitor has been routed for chat and that Qualified is properly staffed.
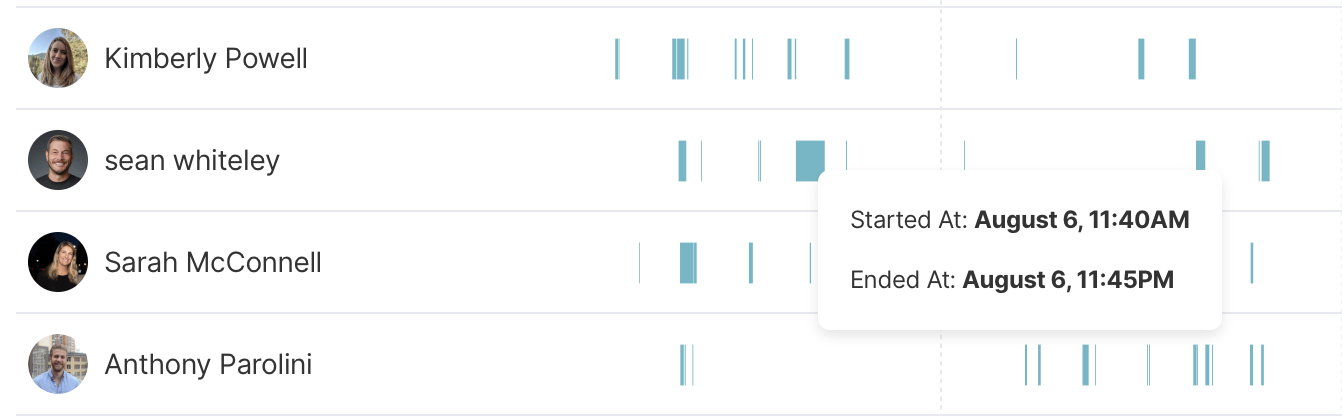
Rep Availability
Qualified will show you how often and how long reps have been available. Hover over the blue markers to see the times the rep turned themselves to 'available' and when they went offline. You'll notice two important numbers from this availability is also carried over to your Leaderboard tile: "Total Available Hours" and "Avg. Daily Hours."
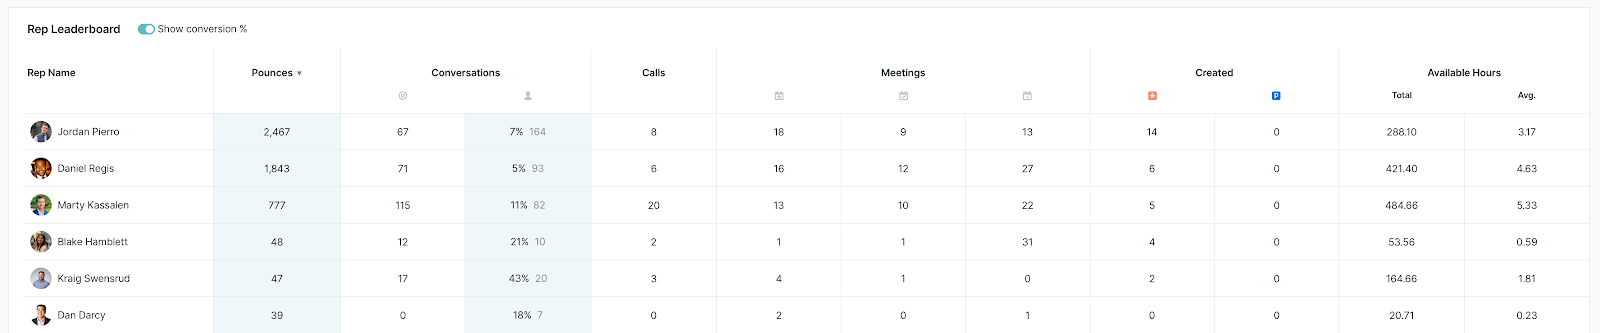
Sales Rep Leaderboard
At the bottom of your dashboard, you'll see a leaderboard showing which of your reps are engaging the most with your visitors. This includes:
- Pounces (or proactive engagement with visitors)
- Conversations (routed and proactive)
- Percentage of proactive engagements that resulted in a conversation with a visitor
- Calls completed with a visitor
- Number of meetings offered
- Number of meetings booked
- Number of leads or prospects created
- Total available hours
Set your date range by using the date picker on the right-hand side of your screen to select the dates you wish to view.
When selecting a time frame on the first dashboard tile that it sets the same corresponding date and time data point across all tiles. Use this to keep track of the same time frame across multiple tiles of information.
<span id="sharing-dashboards"></span>
How to Share and View Dashboards
Sharing dashboards allows you to share with non Qualified users by granting them access to view your dashboards. Here's a step-by-step guide on how to share and view dashboards.
Sharing Dashboards
- Permission Required: Ensure you have the "Permission to share dashboards." All admins have this permission by default.
- Locate the Share Icon: On both personal and team dashboards, find the "Share dashboard" icon at the top left, next to the "Add tile" icon.
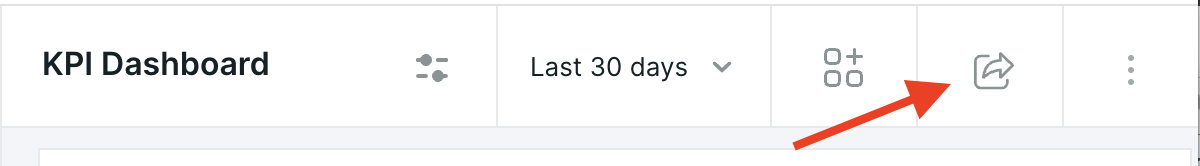
3. Open the Sharing Dialog: Click the "Share dashboard" icon to open a sharing dialog box.
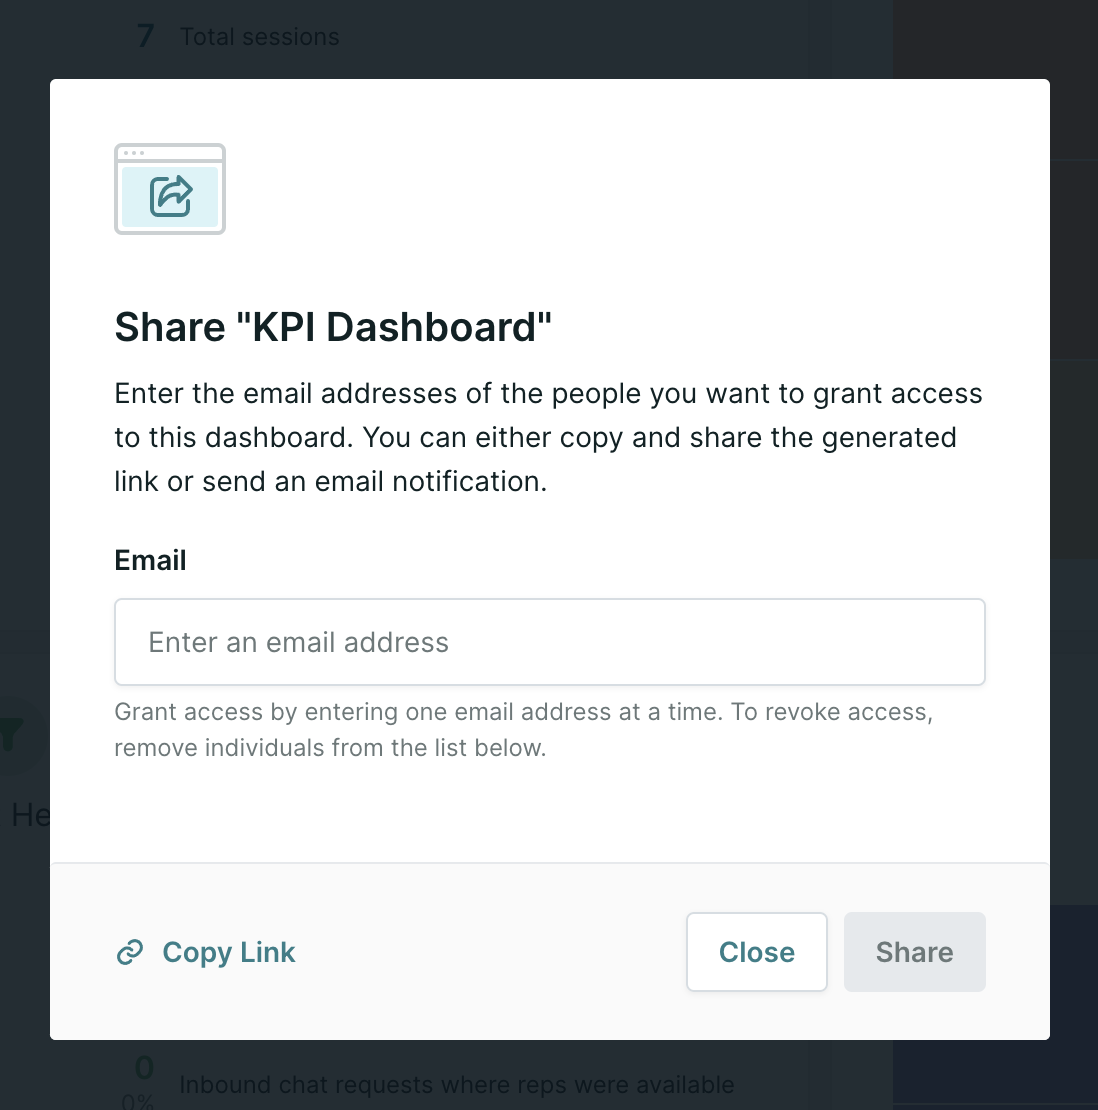
4. Add or Remove Emails:
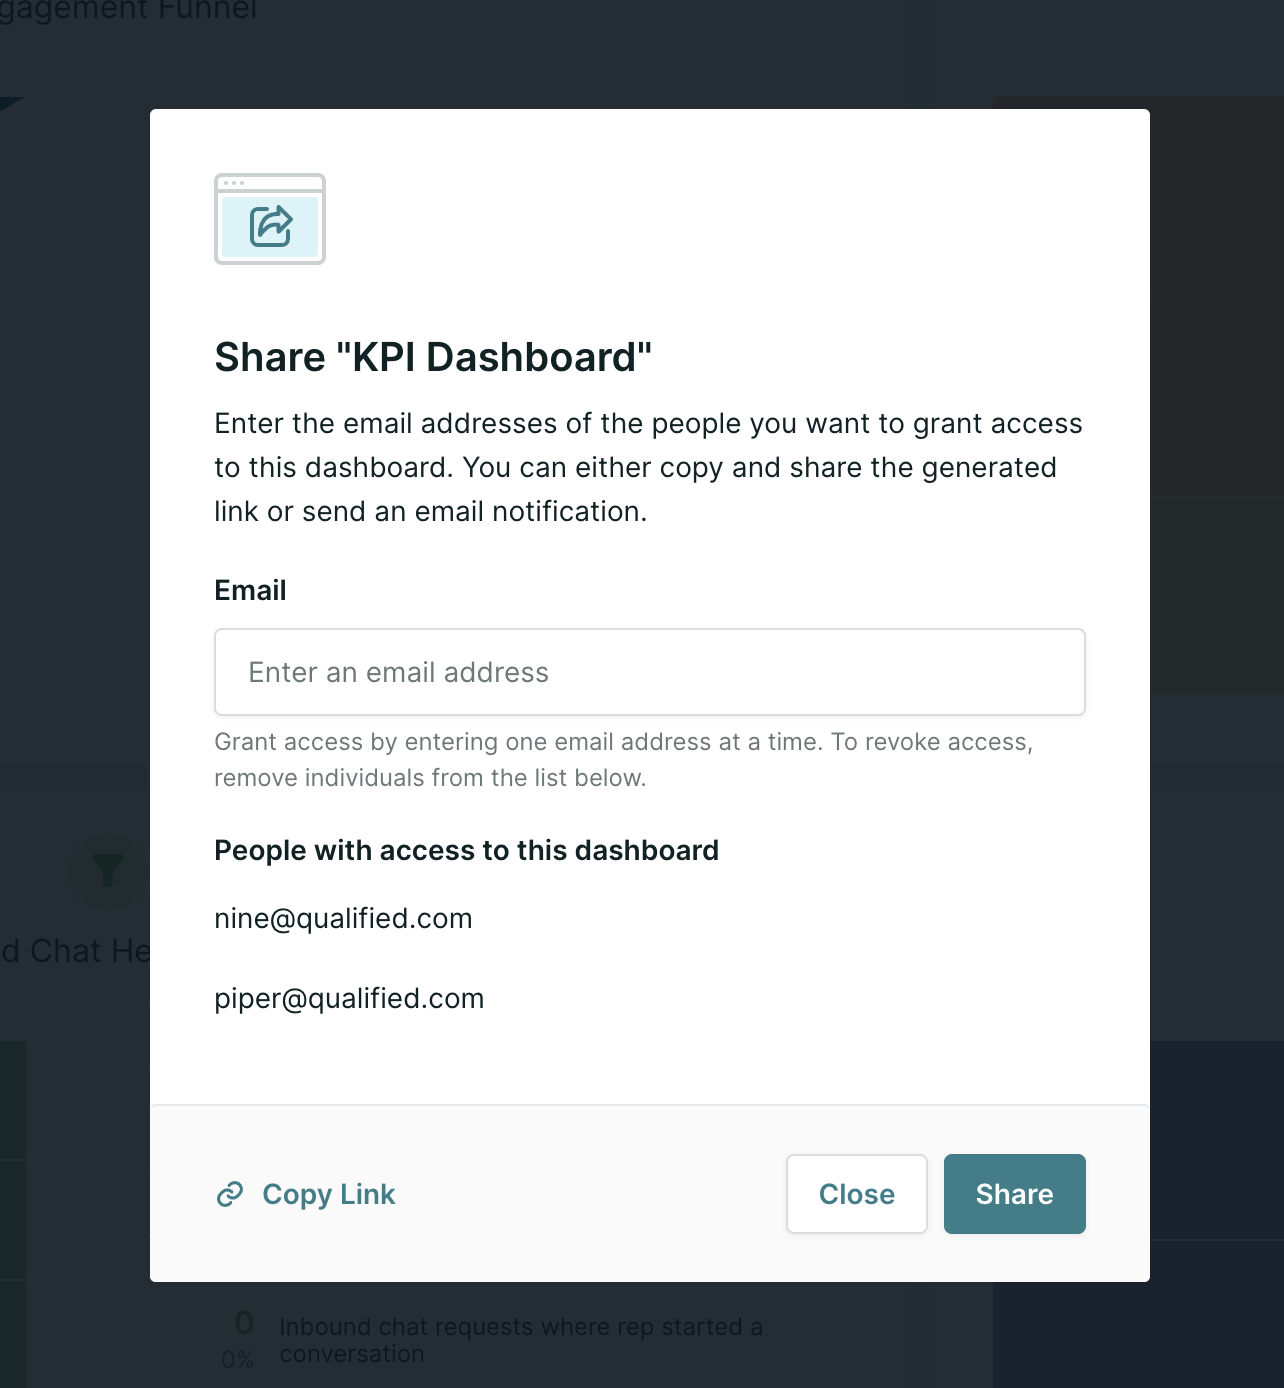
5. Share: Click "Share" to send an email notification to users who have been granted access to the dashboard.
6. (Optional) Copy Link: Click "Copy Link" to generate a general link for all viewers.
7. (Optional) Distribute the Link: Share the copied link with viewers via Slack, email, or other communication channels.
Viewing Dashboards
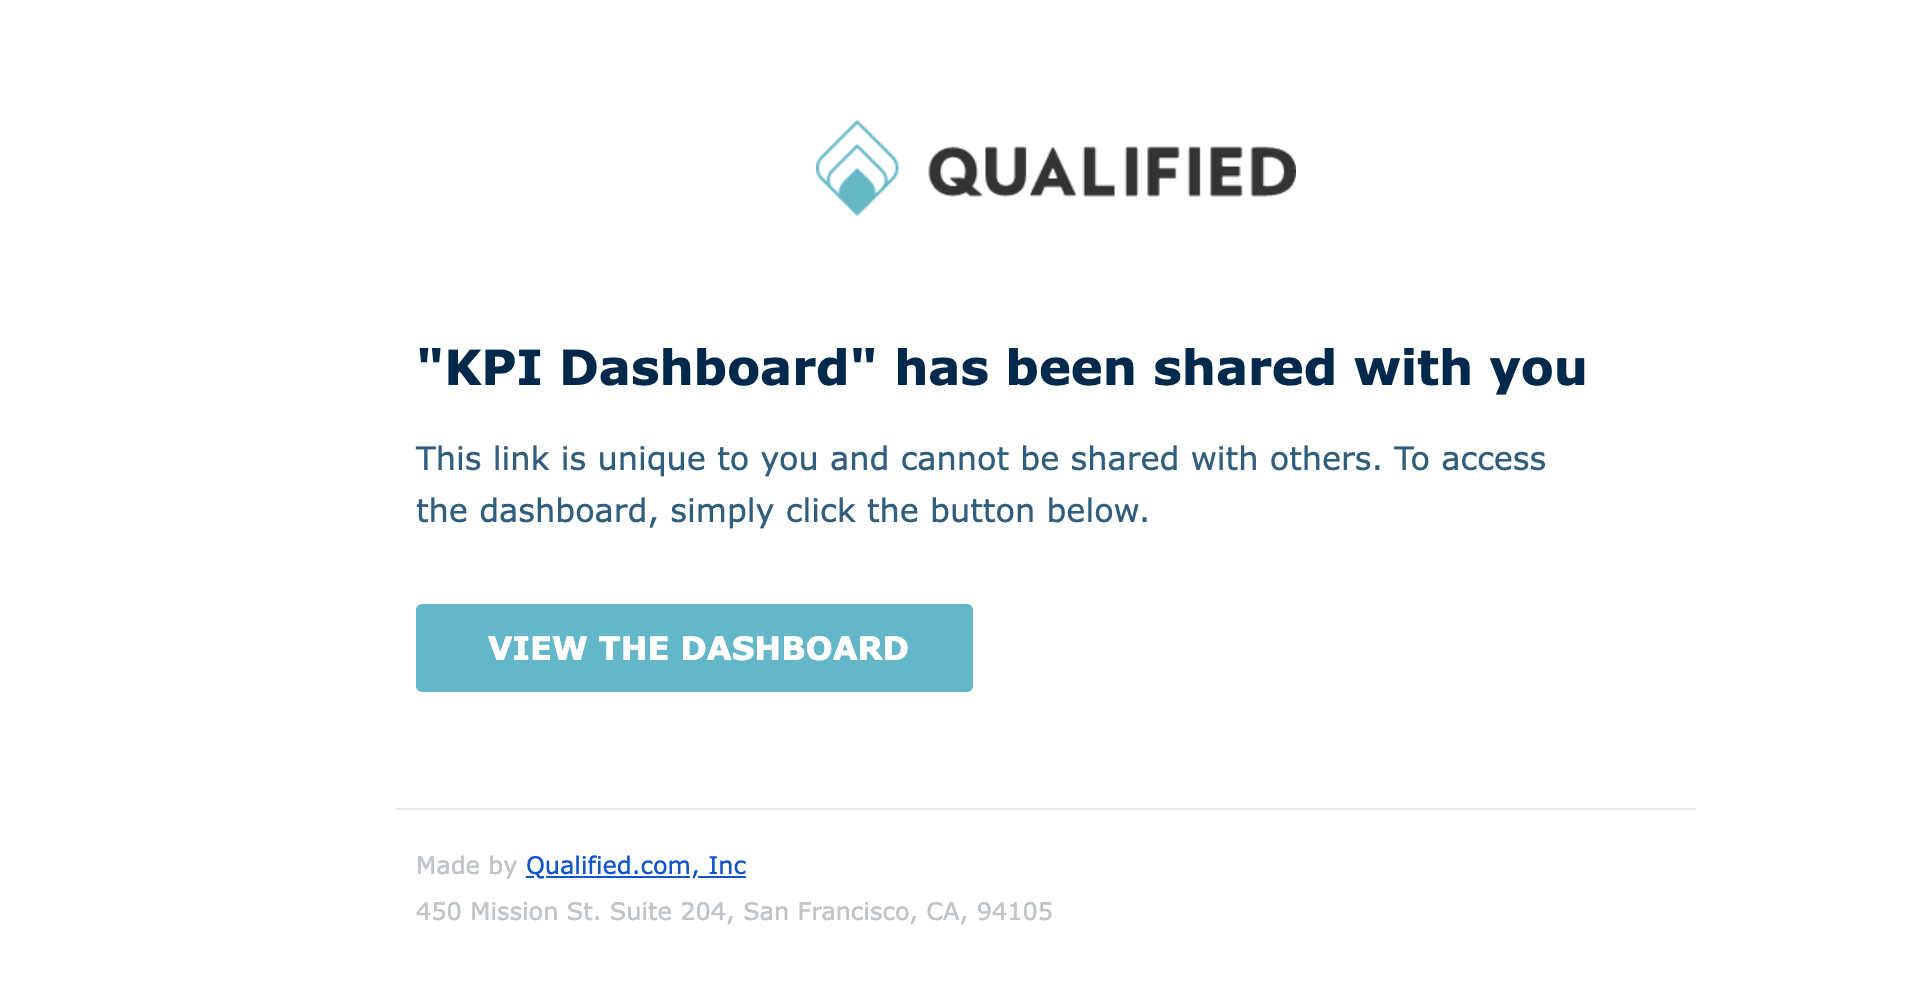
Viewing from an email notification
The email notification sent when "Share" was pressed contains a button that will allow viewers immediate view-only access to the dashboard.
Viewing the Dashboard from a Shared Link
1. Click the Shared Link:
Viewers will receive a link starting with app.qualified.com/view/dashboards
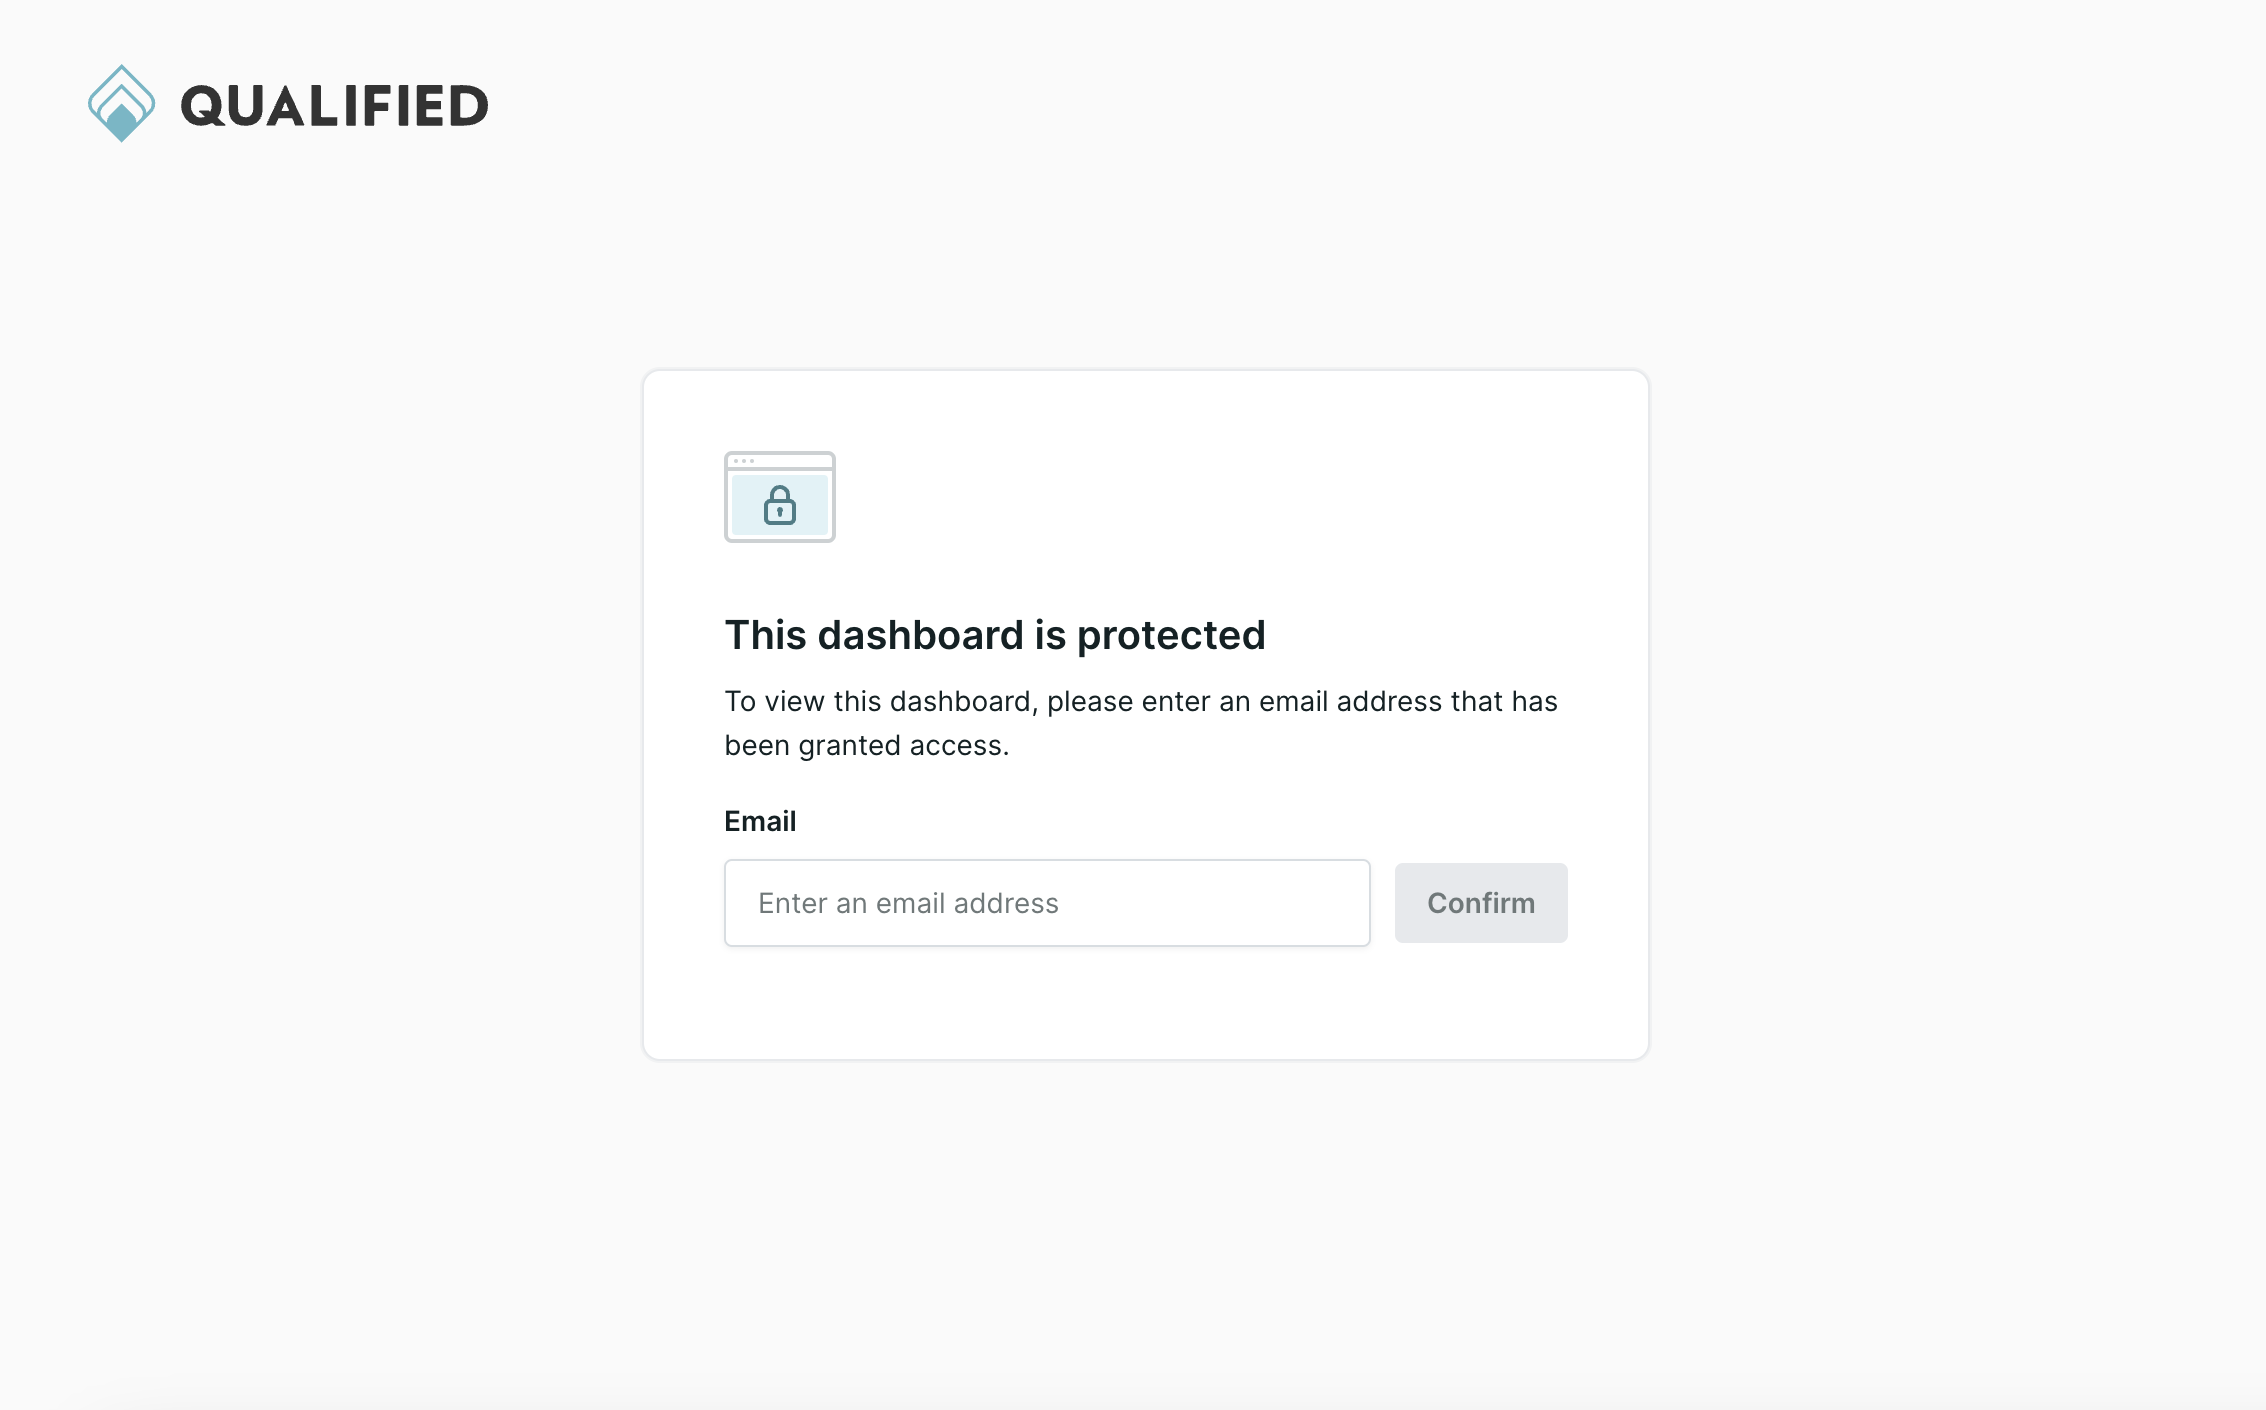
2. Enter Email for Verification:
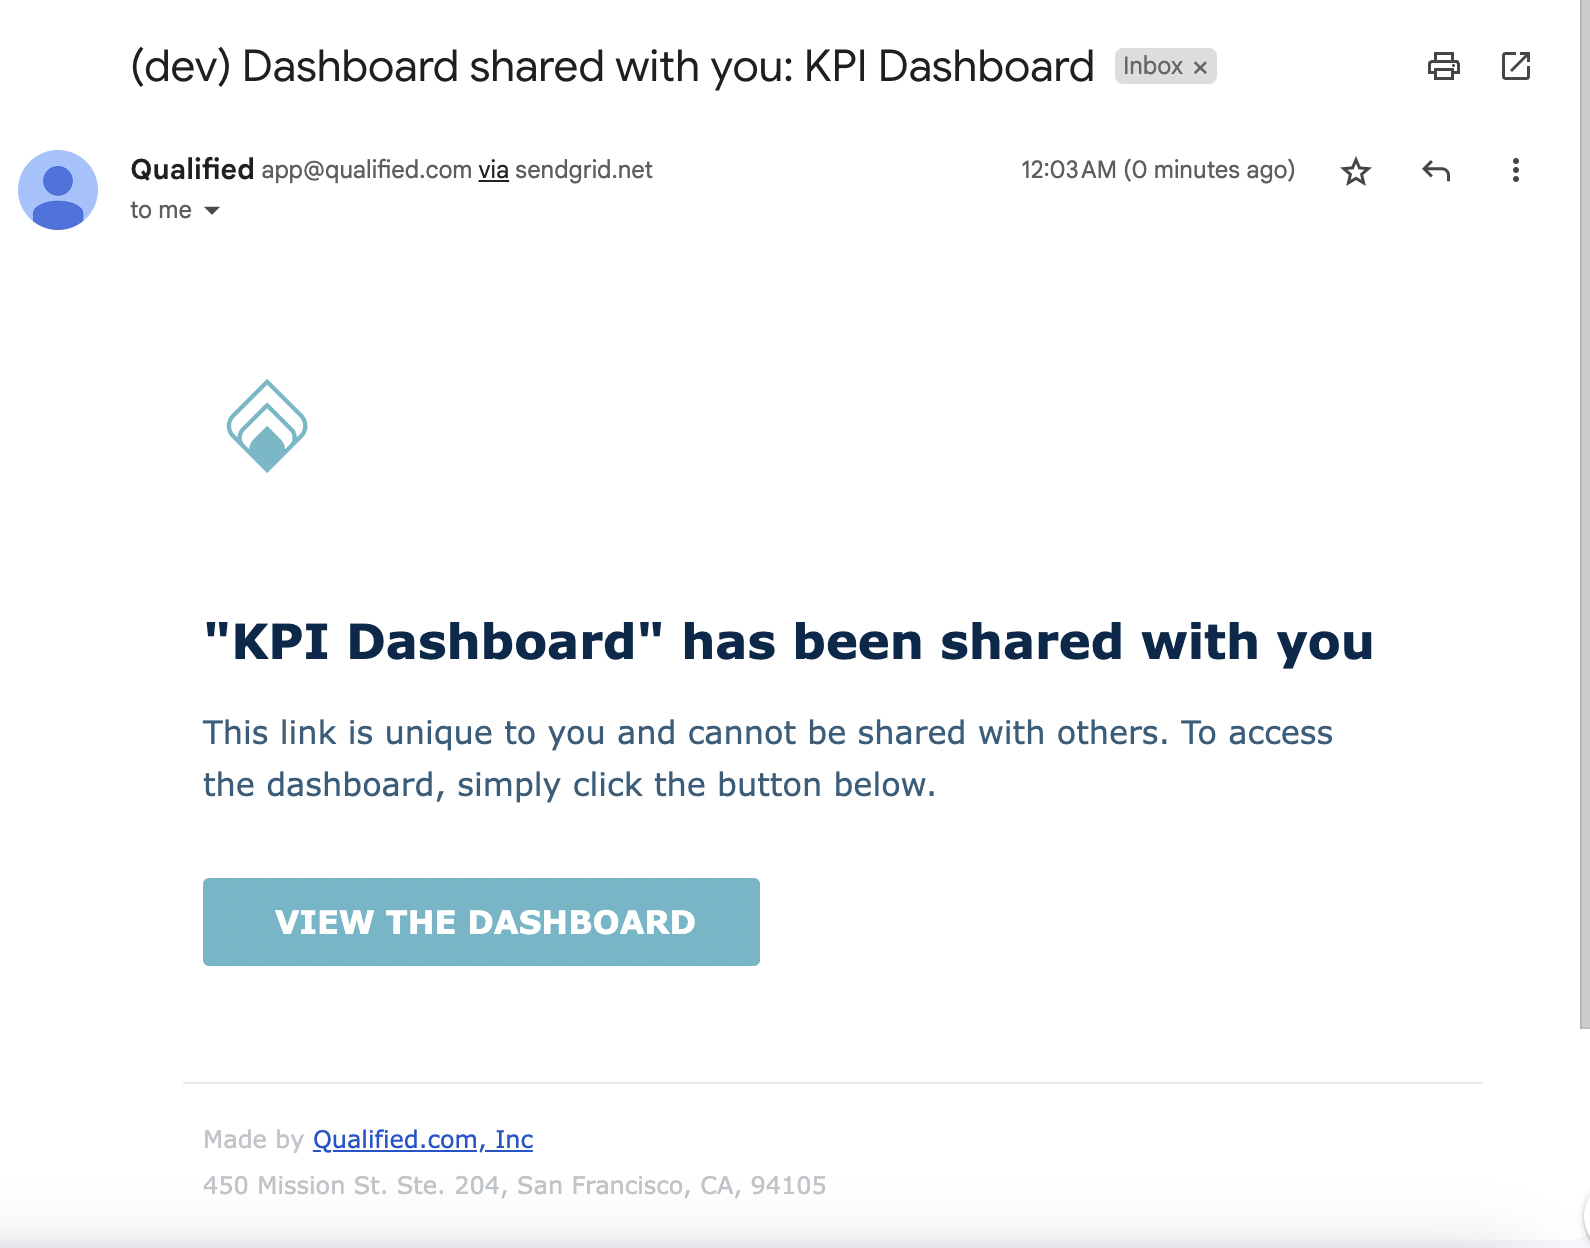
Upon clicking the link, viewers will see a page prompting them to enter their email. After entering their email and clicking confirm, they will receive an email from Qualified with the subject "Dashboard shared with you: <dashboard's title>."
3. Access the Dashboard:
The email will contain a unique, one-time link to view the dashboard. This link includes an email_token parameter to verify access and is valid for 1 hour. If the link is not used within 1 hour, viewers will need to request access again.
4. View-Only Mode:
Clicking the one-time link will take viewers to a view-only version of the dashboard. Viewers cannot add new tiles or adjust filters but can change the date range and switch between Daily/Weekly/Monthly views for line and bar charts.
5. General Link Access:
After using the one-time link once, viewers can access the dashboard using the general link unless:
- The user's permission is revoked.
- The viewer clears their browsing history (cookies).
Heading 1
Heading 2
Heading 3
Heading 4
Heading 5
Heading 6
Lorem ipsum dolor sit amet, consectetur adipiscing elit, sed do eiusmod tempor incididunt ut labore et dolore magna aliqua. Ut enim ad minim veniam, quis nostrud exercitation ullamco laboris nisi ut aliquip ex ea commodo consequat. Duis aute irure dolor in reprehenderit in voluptate velit esse cillum dolore eu fugiat nulla pariatur.
Lorem ipsum dolor sit amet, consectetur adipiscing elit, sed do eiusmod tempor incididunt ut labore et dolore magna aliqua. Ut enim ad minim veniam, quis nostrud exercitation ullamco laboris nisi ut aliquip ex ea commodo consequat. Duis aute irure dolor in reprehenderit in voluptate velit esse cillum dolore eu fugiat nulla pariatur.
Lorem ipsum dolor sit amet, consectetur adipiscing elit, sed do eiusmod tempor incididunt ut labore et dolore magna aliqua. Ut enim ad minim veniam, quis nostrud exercitation ullamco laboris nisi ut aliquip ex ea commodo consequat. Duis aute irure dolor in reprehenderit in voluptate velit esse cillum dolore eu fugiat nulla pariatur.

Block quote
Ordered list
- Item 1
- asdfasdf
- asdfasdf
- asdfasdf
- Item 2
- Item 3
Unordered list
- Item A
- Item B
- Item C
Bold text
Emphasis
Superscript
Subscript
|
|---|
|


.svg)


