
Understanding Qualified Signals Account 360
The Signals Account 360 is a robust account profile that presents an account’s engagement with your campaigns and their likely purchase intent over time. Sales reps and executives alike can view the Signals Account 360 to identify which accounts and opportunities are most likely to close.
<span id="which-accounts"></span>
Which Accounts Have a Signals Account 360
Qualified Signals creates an Account 360 for every newly recognized account the first time someone associated with that account visits your website. There are two scenarios when this happens:
- A visitor is matched with an account in your Salesforce instance.
- A visitor is not matched to your Salesforce instance but we can infer which company they’re associated with due to your data enrichment integrations, like Clearbit Enrichment.
<span id="viewing-account-360"></span>
Viewing an Account 360
To open an account’s Account 360, all Qualified users can:
- Click the Signals icon on the left.
- Click on the title of an account list.
- Click on a specific account name.
The Account 360 includes:
- Account overview
- Timeline of ABM-related activities
- Activity Panel highlighting sales and marketing campaign engagement
- Live View of visitor sessions
Add the Account 360 to your Salesforce account page layout to surface relevant Signals data where your team already monitors their accounts.
<span id="account-overview"></span>
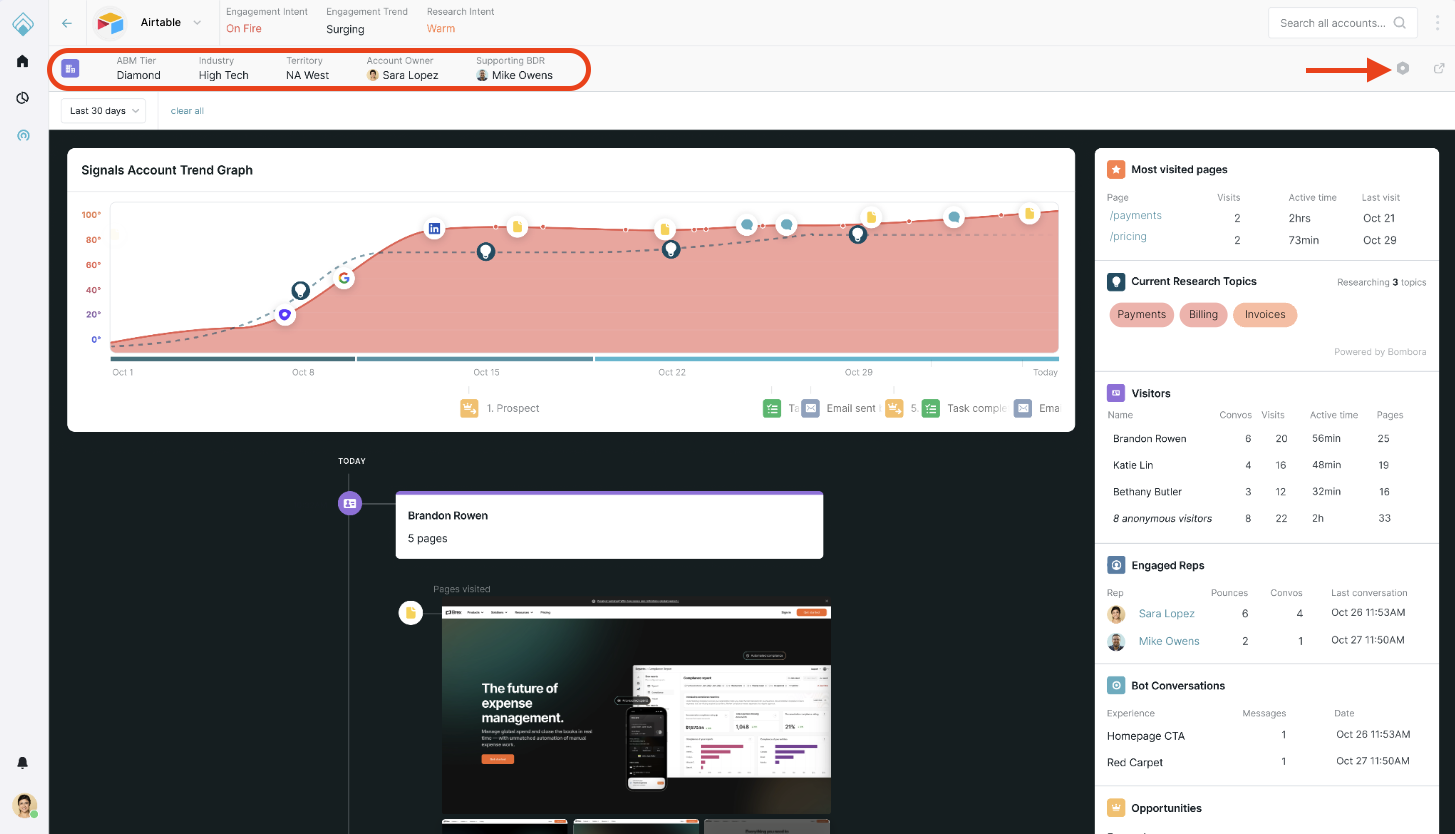
Account Overview
High-level information about the account is visible along the top of the screen. The first row shows the account’s Signals data, like Research Intent and Engagement Intent.
To customize what appears in the second row, click the Gear icon and check your wanted fields. You can also click the neighboring Arrow icon to open the account’s Salesforce record in a new browser tab:
<span id="timeline"></span>
Timeline
The Account 360 includes an interactive timeline that defaults to the Last 30 Days. You can adjust the time period from the drop-down menu:
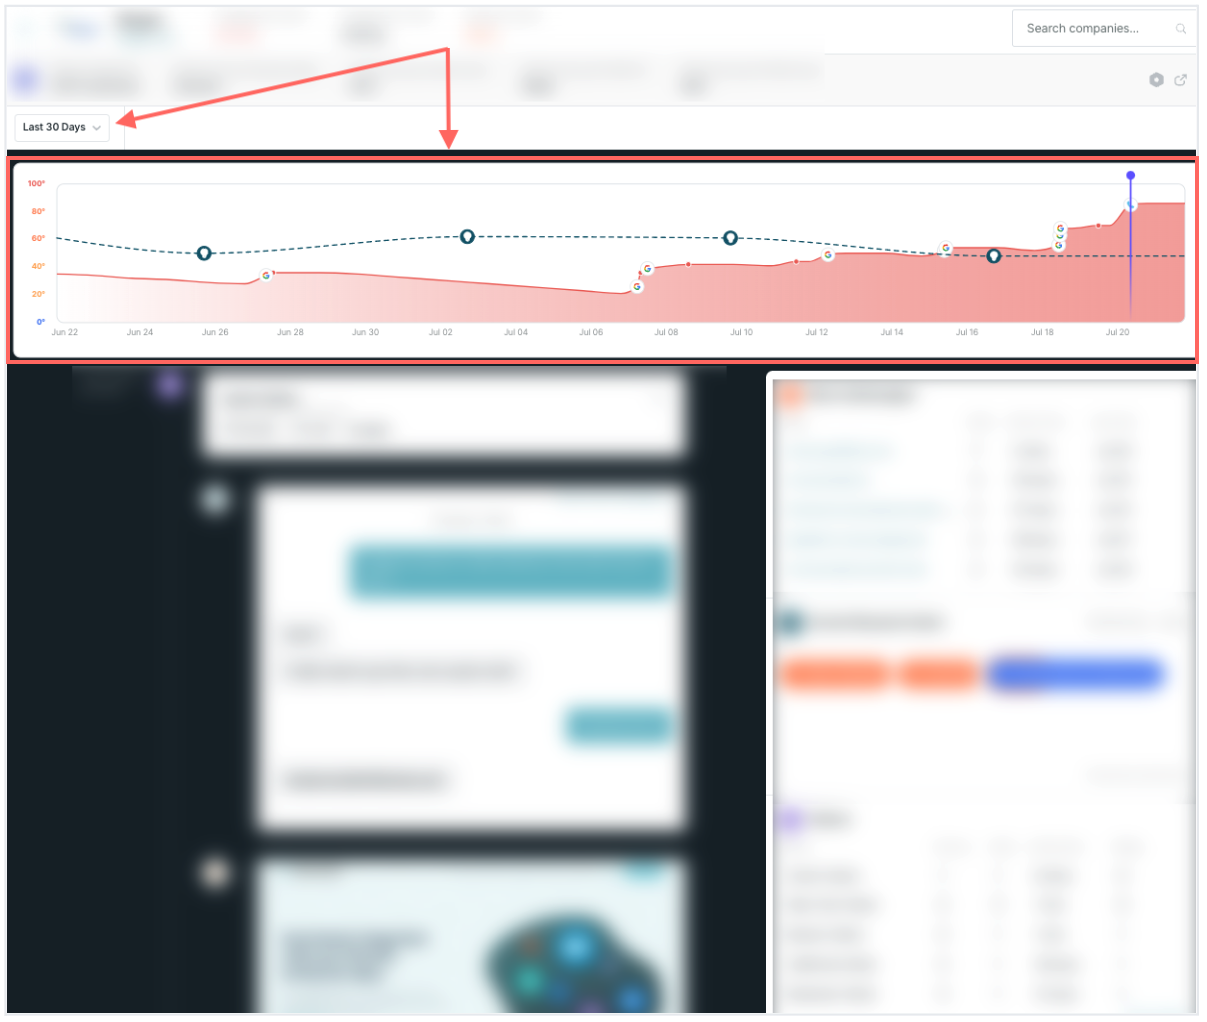
There are a few key components.
Research Intent Over Time
The dotted line graph is the account’s Research Intent over time. The Lightbulb icon specifies when it was calculated because Research Intent is calculated only once per week.
When you hover over the Lightbulb icon, the tooltip shows which topic was factored into the Research Intent.
You may notice that the Research Intent graph doesn’t extend the full time period. The graph starts after you first select which topics are used to calculate it.
Engagement Score Over Time
The shaded portion is the account’s Engagement Score over time. A high score suggests that visitors from that account have purchase intent.
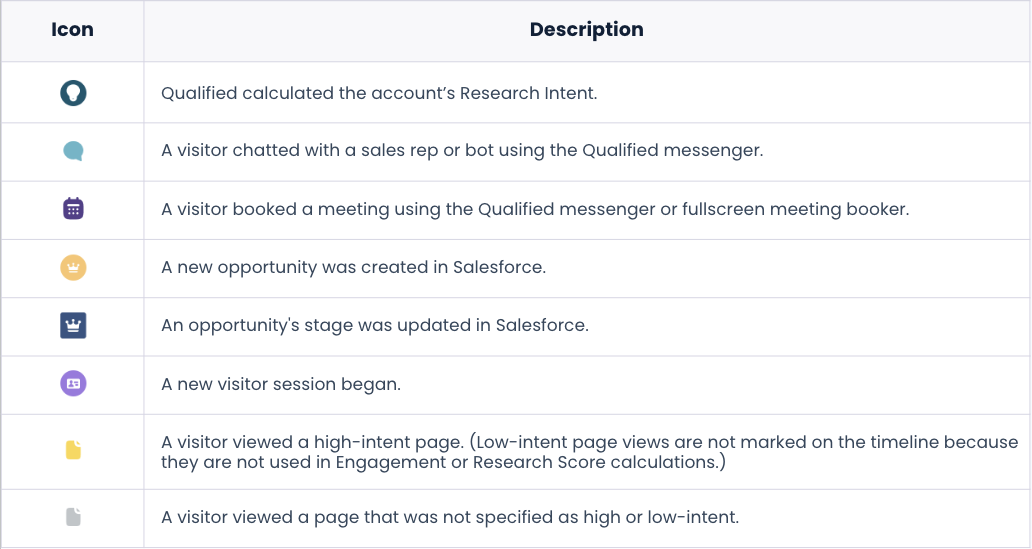
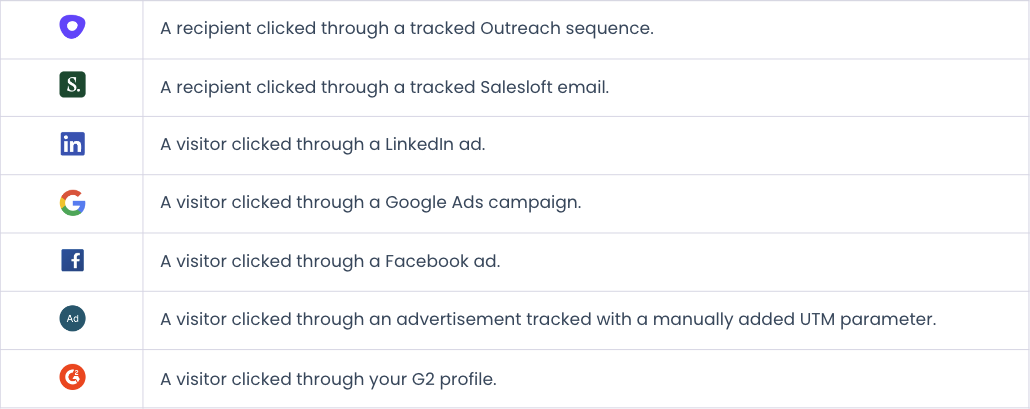
Meaningful Event Icons
Icons are placed on the Engagement Score timeline when an activity affects the Engagement Score. Hover over each icon for more information about that event. When you click on it, the Live View scrolls to that event. These icons include:
<span id="activity-panel"></span>
Activity Panel
To help you understand trends, more granular details about an account’s interactions with your company are listed:
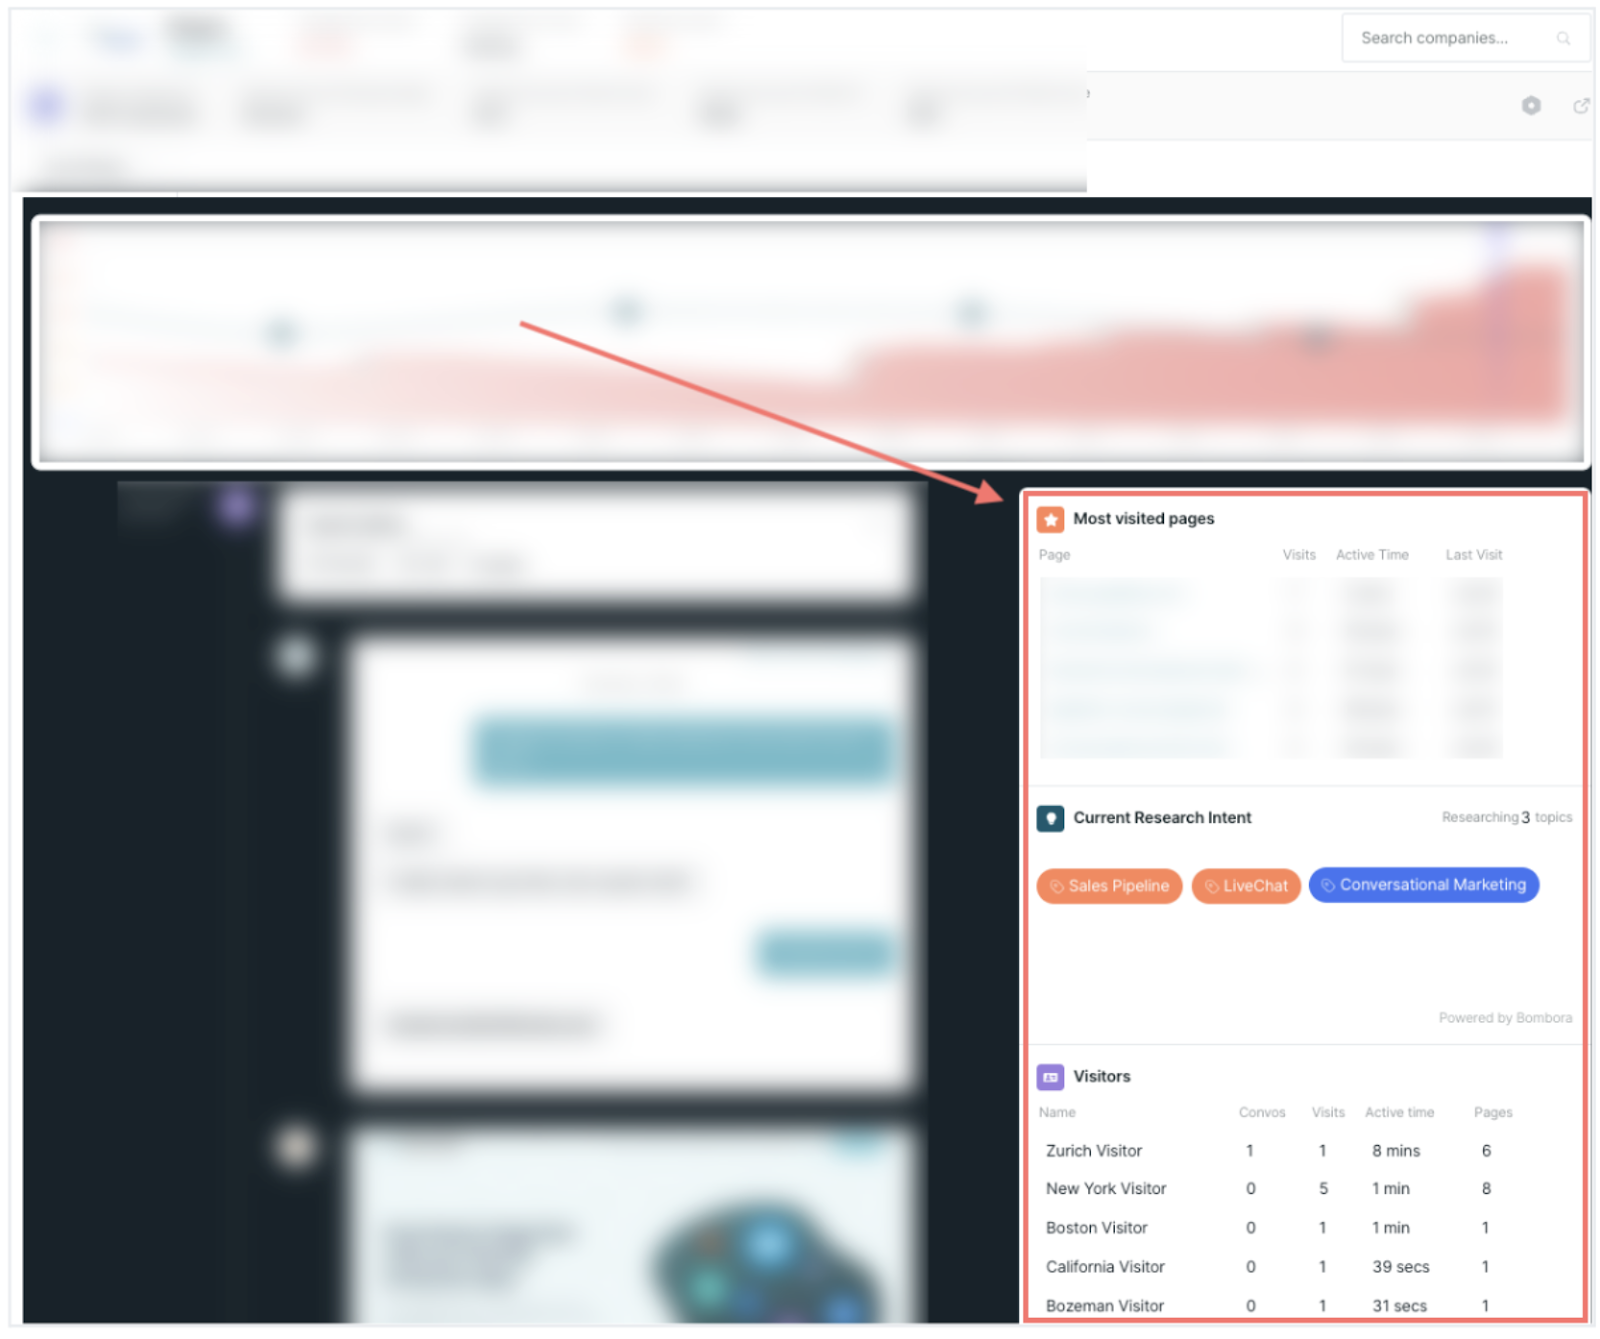
For example, it shows what topics visitors from that account are researching, which ads they click through, and how many conversations they’ve had with your sales reps.
<span id="live-view"></span>
Live View
When you open the Account 360, the Live View appears on the left. This aggregates all information Qualified tracks about an account in one place. Scroll through the Live View to review:
- How the visitors arrived on your website, like clicking through a Paid Ad campaign or an outbound email. If relevant, an image of the ad or the email’s text
- Which pages they browsed, including per visited page:
- A visual screenshot of that page
- What time the visitor arrived on that page
- How long they remained on that page
- When a Salesforce opportunity is created or its stage is updated
- When a visitor has a conversation with a sales rep or bot in the Qualified messenger
You can click on the visitor cards to open their Qualified session. To open their lead or contact record in Salesforce, click the Arrow icon on the right:
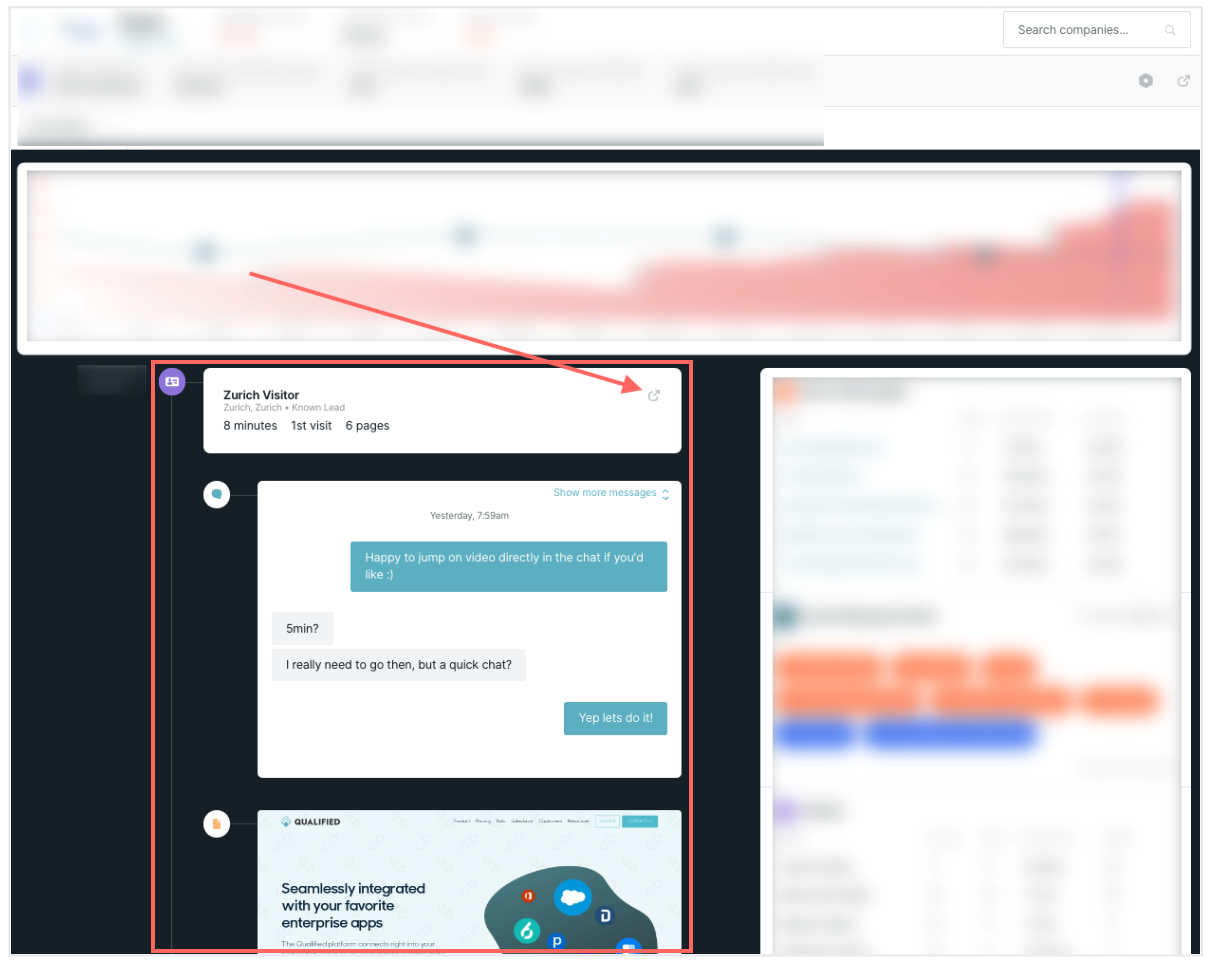
Click on a visitor from the right activity panel or Chat icon on the Engagement Score timeline to open their session in the Live View.
Heading 1
Heading 2
Heading 3
Heading 4
Heading 5
Heading 6
Lorem ipsum dolor sit amet, consectetur adipiscing elit, sed do eiusmod tempor incididunt ut labore et dolore magna aliqua. Ut enim ad minim veniam, quis nostrud exercitation ullamco laboris nisi ut aliquip ex ea commodo consequat. Duis aute irure dolor in reprehenderit in voluptate velit esse cillum dolore eu fugiat nulla pariatur.
Lorem ipsum dolor sit amet, consectetur adipiscing elit, sed do eiusmod tempor incididunt ut labore et dolore magna aliqua. Ut enim ad minim veniam, quis nostrud exercitation ullamco laboris nisi ut aliquip ex ea commodo consequat. Duis aute irure dolor in reprehenderit in voluptate velit esse cillum dolore eu fugiat nulla pariatur.
Lorem ipsum dolor sit amet, consectetur adipiscing elit, sed do eiusmod tempor incididunt ut labore et dolore magna aliqua. Ut enim ad minim veniam, quis nostrud exercitation ullamco laboris nisi ut aliquip ex ea commodo consequat. Duis aute irure dolor in reprehenderit in voluptate velit esse cillum dolore eu fugiat nulla pariatur.
Block quote
Ordered list
- Item 1
- asdfasdf
- asdfasdf
- asdfasdf
- Item 2
- Item 3
Unordered list
- Item A
- Item B
- Item C
Bold text
Emphasis
Superscript
Subscript
|
|---|
|


.svg)


